tilauscope_fork
The roast plan
!!! abstract “Artisan does / TilauScope adds” Artisan does — lets you load a previous roast as a background curve and try to follow it by eye. Which reference to use, and whether it was any good, is left entirely to you.
**TilauScope adds** — a plan computed for this coffee, this batch size and this machine,
with milestone targets, phase durations, a staged heat profile and a projected
[DTR](/glossary.html#dtr--development-time-ratio). Every value states where it came from, and
the ones derived from your own previous roasts of the same coffee say how many roasts are
behind them.
Where the plan lives
The plan lives on the ⓘ PLAN tab of the roast setup sheet, which Plan on a BeanCave bean record opens directly — see Preparing a roast. The tab shows it as a roadmap: the four milestones with their temperatures, times and machine settings, and the weight to expect after cooling. Opening the sheet commits to nothing, so the tab is also where a batch is tried out before it is roasted.
The plan is built from three choices kept at the top of the tab — the batch weight, What is this coffee for? (Filter, Omni or Espresso) and the roast level — and from the room. The use is the same setting as in the guided assistant: change it in either place and both follow. It sets the development time (filter the shortest, espresso the longest, omni between the two) and carries through to the drop temperature and the weight loss to aim for. The room comes from the ambient probe, or, without one, from the online weather or values typed in; its temperature moves the charge, and its altitude moves first crack — see What the coffee and the room are doing.
Two things take the plan off the screen:
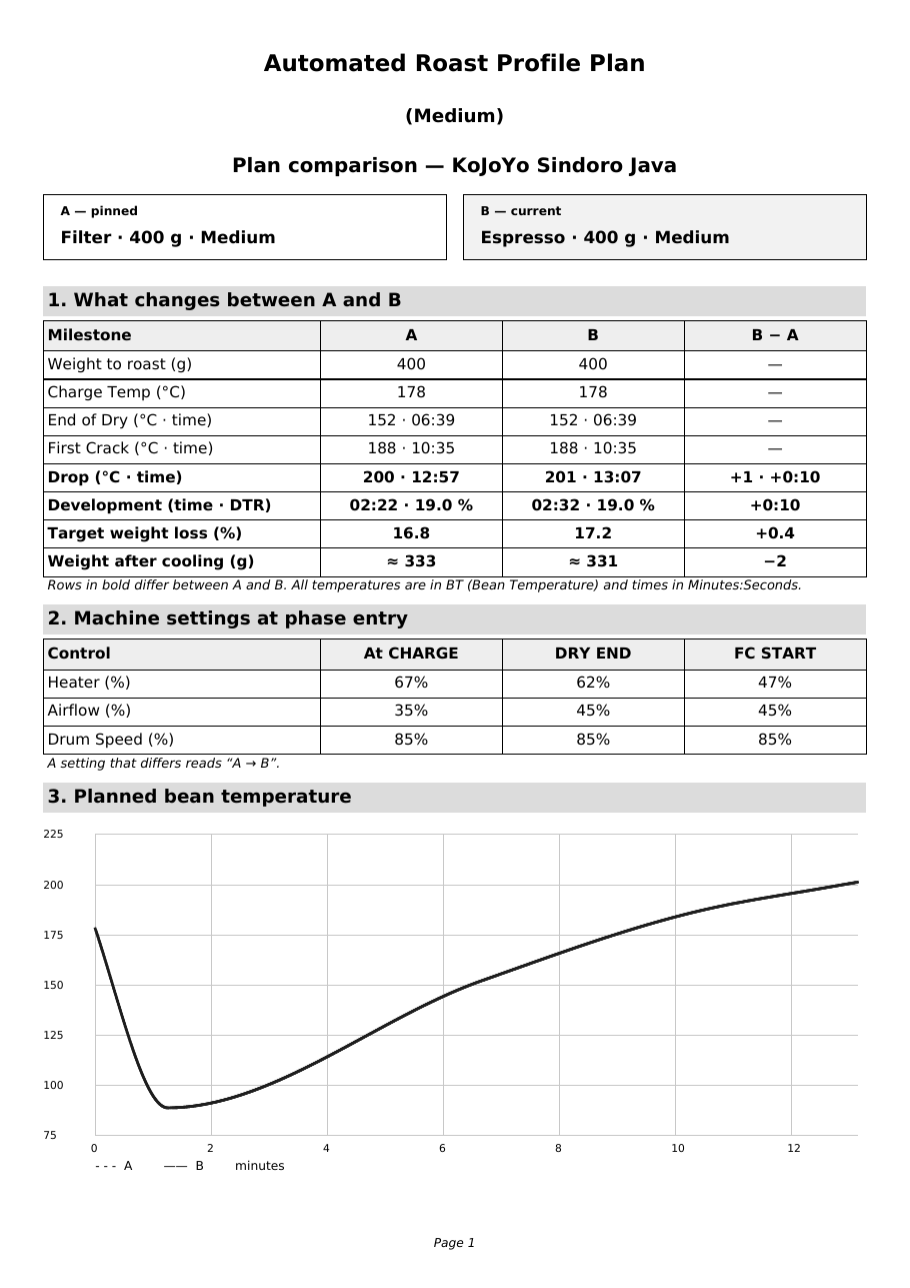
- 📄 PDF — saves the plan as a PDF: everything described below is in it. With a plan pinned for comparison, the document opens with a page setting the two plans side by side. The plan’s alarm set is saved as an alarm file next to the PDF, to reload later from the alarm editor.
- Load the plan’s alarms at start — at the Expert level, loads the plan’s alarm set in place of the current alarms when the roast starts, so the roast is set up before it begins.
!!! note All three control ramps are armed, not just the burner: the heat ladder through Maillard, the airflow opening that follows the browning, and the development ramp where the fire eases while the air supports the reaction. Each step fires on its own bean-temperature threshold. The airflow also climbs to its Maillard value in steps of one machine notch as dry end approaches, instead of being posted there in one move at the milestone itself. The rows posted at dry end and at first crack are the value the ramp holds as the milestone is crossed — the same figures as the phase-entry table — so a milestone never jumps a lever to where the ramp is only due to arrive later.
The PDF and the roadmap are the same plan. The guided assistant builds its own when the roast starts, from the same coffee, the same room and the same machine.
The plan prints in the language TilauScope is set to, whichever alphabet that language uses: Greek, Cyrillic, Chinese, Japanese, Korean, and Arabic, Persian or Hebrew read right to left. Coffee and farm names print in their own script too. Thai is the one exception — it has no letterforms available and prints blank.
What the plan contains
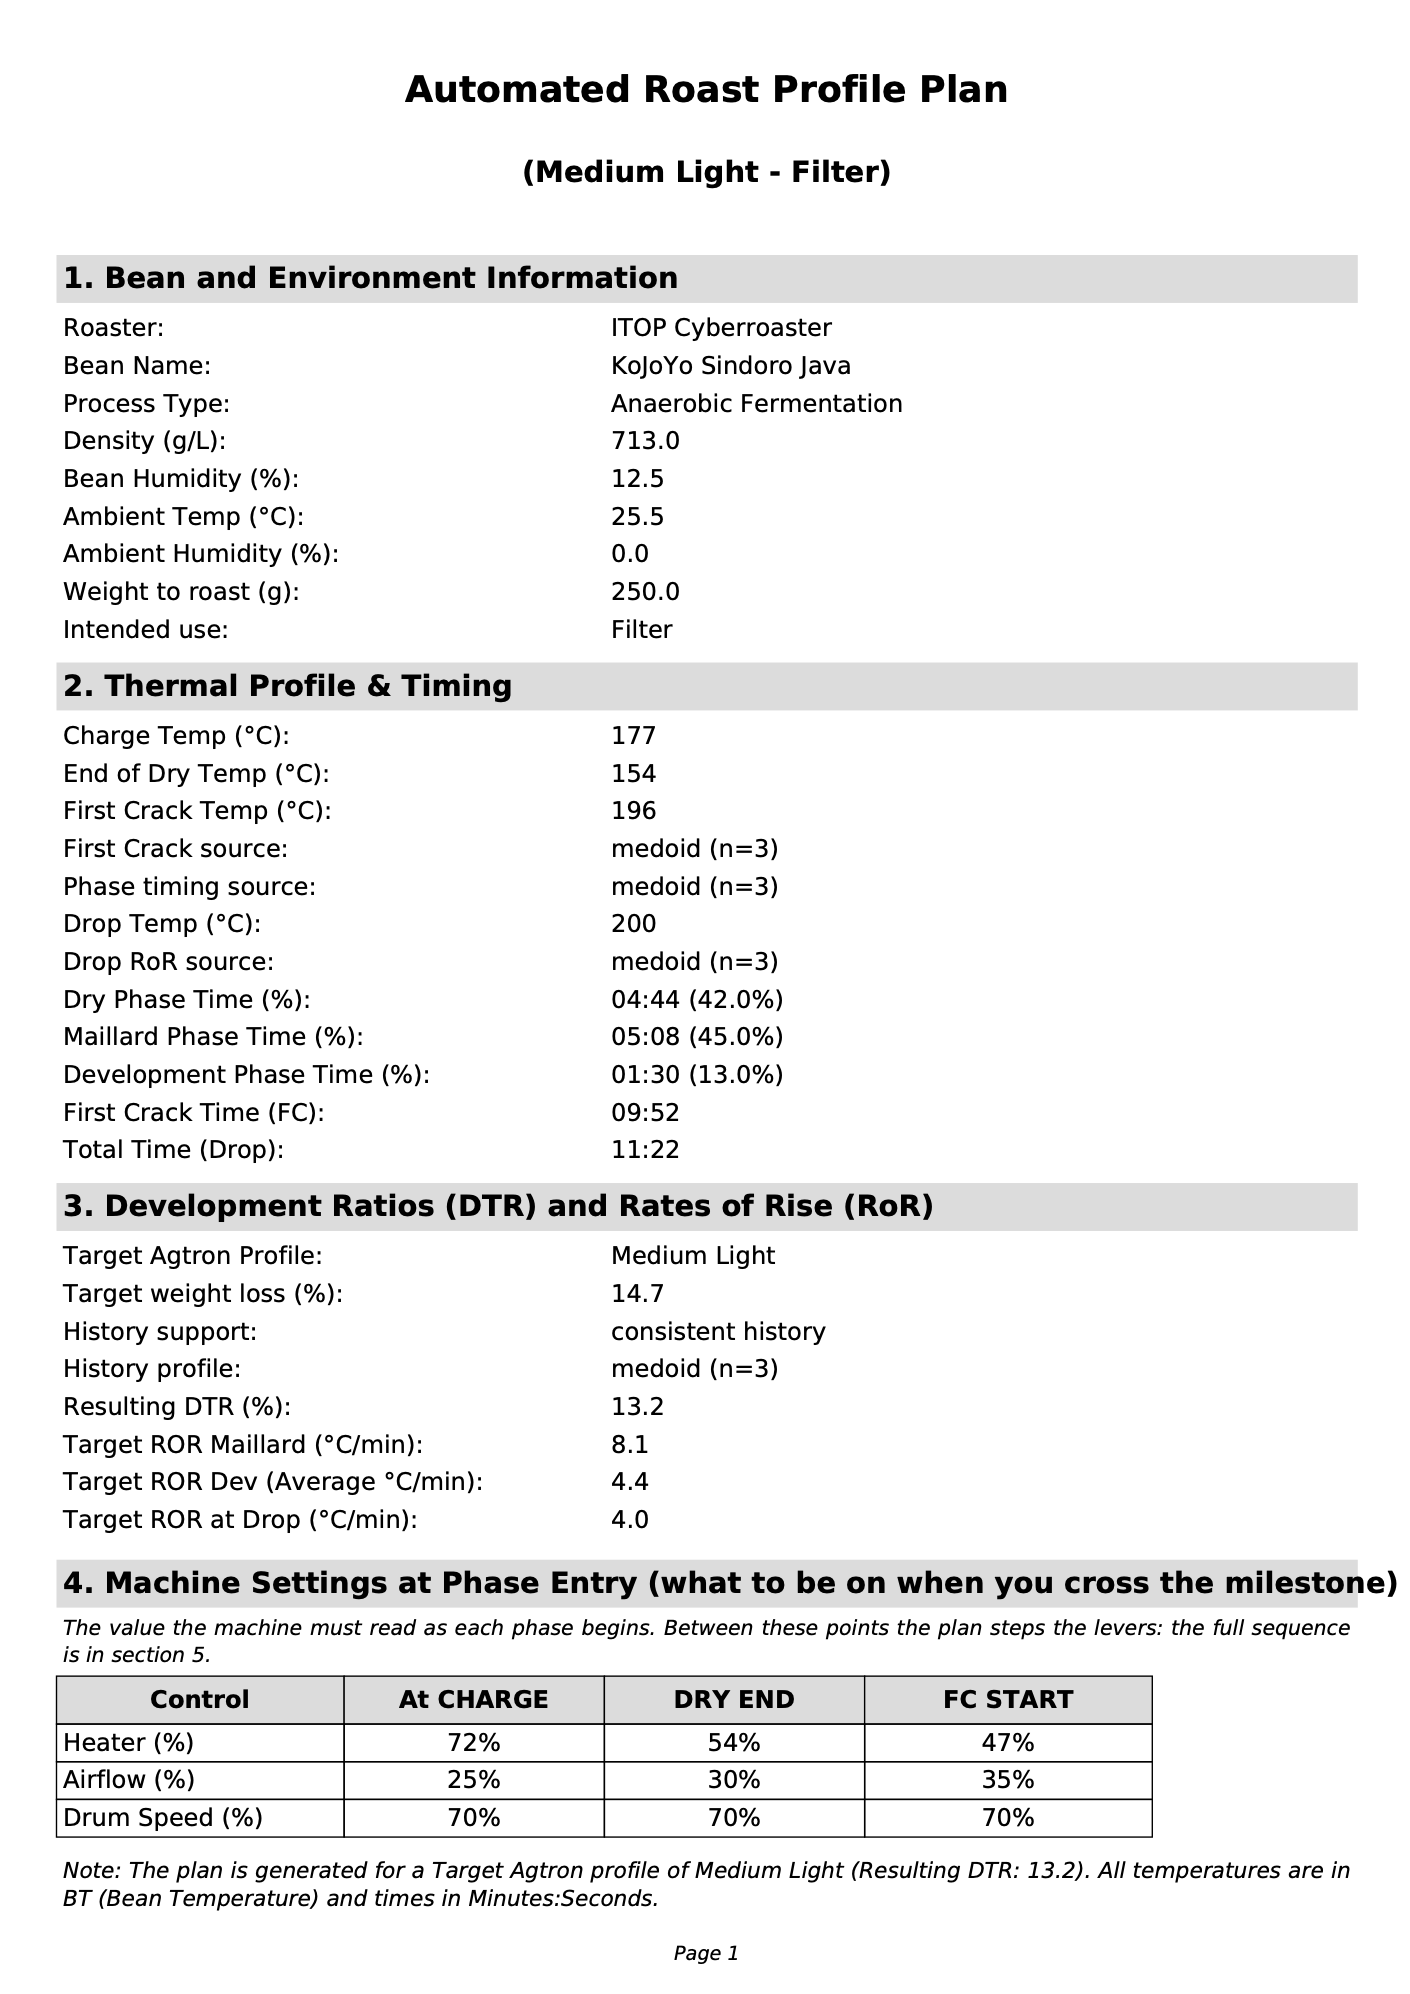
The coffee and the batch. Bean Name, Weight to roast, Roaster, Target Agtron Profile, Intended use — the filter / omni / espresso choice, also printed beside the roast level in the page heading — plus the coffee’s own properties — Density, Bean Humidity, Water Activity, Process Type — and, where an ambient probe is fitted, Ambient Temp. A plan is specific to a batch on a day, not to a coffee in the abstract.
Bean humidity and water activity are not the same measurement, and the plan uses both. Humidity is how much water the coffee holds — the mass to heat and evaporate, so it sets the burner, the charge temperature, the push through first crack and how long the coffee coasts at the end. Water activity is how freely that water leaves, so it sets the airflow. A coffee can hold plenty of water that leaves reluctantly, and both facts are true at once: neither reading cancels or replaces the other, and one being absent never makes the plan guess it from the other. Humidity hardly changes how long drying lasts: on this machine the drying time follows the batch weight, the variety and the process, and a wetter coffee is met with more energy at the start, not a longer wait.
The variety has a say in the charge. A coffee’s process decides how hot it can safely be charged — the sugars on the surface of a natural scorch where a washed coffee would not — but it is the bean family that says what pace the coffee wants. Both are applied: the process sets the limit, the family moves the charge a few degrees inside it, and the limit always wins. A Typica charges hotter than a Bourbon of the same process, but a Typica that is also a natural still charges cooler than a washed one, because the risk of burning the surface outranks the preference for a quicker roast.
The move is deliberately small — about four degrees, worth roughly fifteen seconds of drying — and it is weighted by how much the variety can be trusted: full weight for a single named variety, half for a blend, and none at all when the record names no variety or names one TilauScope does not place in a family. Around half of the varieties in the catalogue are in that last group on purpose. The charge then reads exactly as it did before, and the intent card says so rather than leaving you to wonder.
Density beats altitude, on the other hand: altitude only tells you a coffee is probably hard, density tells you it is. A clearly soft coffee is charged cooler and given less power early, because it scorches at a setting a harder one carries without marking; a clearly hard one is charged hotter, and density is the one property allowed to take the charge past the usual range for its process, because a hard coffee genuinely takes what a soft one of the same process could not. When density is on the record, altitude is ignored rather than added on top; when a property is missing, nothing is applied for it and the plan uses its grid.
Between those two ends the plan says nothing. Most coffees sit in a broad middle — on a typical shelf, four roasts in five — where one record reads 710 g/L and the next 730, and there is no honest way to tell those two apart. The figure on a record is almost always the supplier’s, not one you weighed by water displacement, and coffees of the same variety are found across the whole range, so a twenty-point difference between two ordinary coffees is as likely to be how the number was obtained as anything about the beans. The plan therefore treats that middle as no information rather than as a small instruction, and keeps its density adjustment for the coffees that are genuinely soft or genuinely hard. Where it used to move the charge by as much as seven degrees for a coffee in that middle, it now moves it not at all.
The practical consequence: weighing a coffee’s density is worth more than reading it off a sack. Fill a 50 ml cylinder to 40 ml with water, drop in beans until the level reaches 50 ml, and weigh them — a dry measure counts the air between beans as if it were coffee.
When only the altitude is known it still stands in for the density, but it now carries far less weight than the measurement it replaces — a nudge of about a degree on the charge, where a real density can move it by seven. Altitude causes nothing on its own: the tree answers to light, to the average temperature, to the gap between day and night and to how fast the cherry ripens, and a coffee grown at two hundred metres in an ocean current can be as hard as one grown at fifteen hundred. Checked against the coffees whose record holds both figures, altitude points the right way only about a fifth of the time, and points the wrong way often enough — a soft coffee grown high reads as hard — that it must not be allowed to overturn what a weighed density would have said. Weighing the coffee’s density on the record is therefore worth far more to the plan than filling in its altitude.
Ambient Humidity is still recorded on every roast, but it no longer changes a plan. Its influence is on the coffee between roasts — a humid room pulls the water activity of stored green upward over weeks — which is where you will find it, in Sacks, stock and conservation.
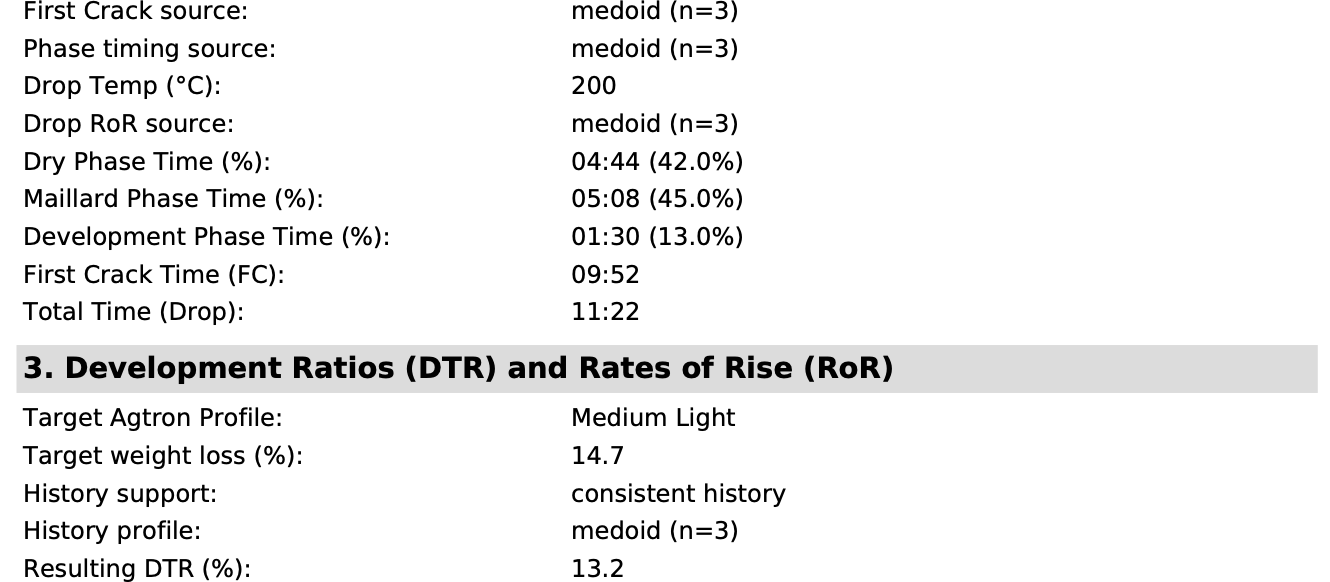
Milestone targets. Charge Temp, End of Dry Temp, First Crack Temp, First Crack Time, Drop Temp.
Phase durations. Dry Phase Time, Maillard Phase Time, Development Phase Time and Total Time — a target per phase rather than one figure for the whole roast. A valid historical Maillard duration is not lengthened merely because it is under 3:00; only a 2:00 technical plausibility guard rejects likely bad milestone data. Style ranges remain guidance.
On a radiant electric roaster these durations are not read off a style table. They are what the rate-of-rise plan costs: the curve leaves the turning point near 16°C/min, enters Maillard near 12, passes 8 a minute before first crack and arrives at the crack at 5 to 6, and drying and Maillard last exactly as long as that climb takes. A larger batch turns lower, so it has further to climb and takes longer — around 250 g dries in about four minutes where 400 g needs closer to six. Nothing states that rule; it falls out of the slope and the temperature to cover.
Drying does not climb at one speed for every batch. The longer the climb, the higher the average rate the machine holds through it; a small batch turns high and starts already past the steep part of the curve, so it never reaches the rate a large batch does. Measured on the Skywalker, a 400 g batch averages about 13.5°C/min from the turning point to the dry end while a 250 g one averages barely over 10. The plan works its drying time out from the climb it actually has to make rather than assuming one speed, which is why a small batch is no longer promised a drying time it cannot hold. Bean moisture, room temperature and your own roast history still shift the result on top.
Maillard is always planned shorter than drying, and shorter by a real margin — four minutes of drying against three of Maillard, or five against four. Equal halves are not a shape this machine roasts: the rate of rise has no time to come down. On a small batch the turning point sits high, so there is little climb left before the dry end while Maillard still has its full span to cover, and the arithmetic alone would invert the two. When that happens it is Maillard that gives way, not drying: drying has a duration the batch size fixes — around three minutes at 150 g, closer to five at a full drum — while Maillard has only a rate to hold, and a rate can be held higher. The plan then leads Maillard more briskly than the usual easing and tells you the rate it settled on.
One case needs a word. When the batch is small the machine cannot dry any faster than its own floor, so drying may be held longer than the climb strictly costs — and a longer dry at the same rate of rise arrives hotter. The plan then raises the dry end by a couple of degrees rather than pretend the bean is where it was, because the rate of rise has to keep falling into Maillard and it cannot do that if drying gains time without gaining temperature.
The Skywalker V2’s post-turning-point rate of rise is centred near 16°C/min in the available history. The plan treats this as a typical reference, not a physical maximum. Values above 16 are common, and the initial placeholder turning point is not used to declare a plan impossible.
Estimated TP is the turning point the plan draws on its own curve — one figure, not two. It is placed from the batch size rather than from the charge temperature alone, because that is what the machine actually does: load half a drum and the temperature dives far less far. Expect a small batch to turn some 25°C higher than a full one charged identically, and expect the drying rate of rise to be correspondingly gentler — there is less climb left to make.
The turning point is read from a table, not from a formula. Like the deviation of a temperature probe, it is described by a set of measured values at fixed load steps rather than by one curve stretched across every batch size: a quarter drum, five eighths, seven eighths and a full load each carry their own figure, taken from the roasts actually recorded at that step, and anything between two steps is read across them. Outside the measured range the plan repeats the nearest known value rather than continuing a slope nothing supports — which is why the dip stops deepening below roughly a quarter drum, and a 150 g and a 250 g batch turn at much the same temperature. Each step is stated as a proportion of the load and of the charge temperature, not in grams and degrees, so the same table describes a roaster it was not measured on. Steps backed by few roasts are marked as such and are the first to be replaced as the history fills in.
RoR targets. Target ROR Maillard, Target ROR at FC, Target ROR Dev and Target ROR at Drop: the slope to hold at each stage. The Maillard figure is an average, and an average says nothing about where the roast lands — Target ROR at FC is the arrival value, and it is the one that decides first crack. On a radiant roaster it is prescribed by the plan rather than deduced from the curve, because entering the crack at 8°C/min instead of 5 gives a medium roast even on a one-minute development. The four figures fall from one to the next: a plan whose development average sits above its first-crack figure would describe a curve that speeds up after the crack, and the plan now says so instead of printing it silently.
Drop temperature. On a radiant roaster this is worked out, not looked up: development starts at the prescribed first-crack slope, keeps easing towards the drop slope, and the temperature that climb reaches is the target. Measured colours from your own roasts still correct it — a table of drop temperatures by roast level does not survive a change of machine or probe, your own record of what a colour reading cost does.
Development. Resulting DTR (%) — development itself is planned as a duration at the right temperature and rate of rise for the batch, and the ratio is the figure that comes out of it, known before charging rather than discovered at the end. When it falls outside the usual range for the roast level, the plan notes it as a sign to look at the front of the roast, not at development.
On a radiant electric roaster the development window is shorter than the general table suggests: roughly 0:45 to 1:00 for a light roast and about 1:30 for a medium light one. The radiant element finishes the roast quickly, and a light roast held a full two minutes past first crack usually lands medium. The total time does not change with it — the extra time goes back into Maillard, where the sugars have longer to develop.
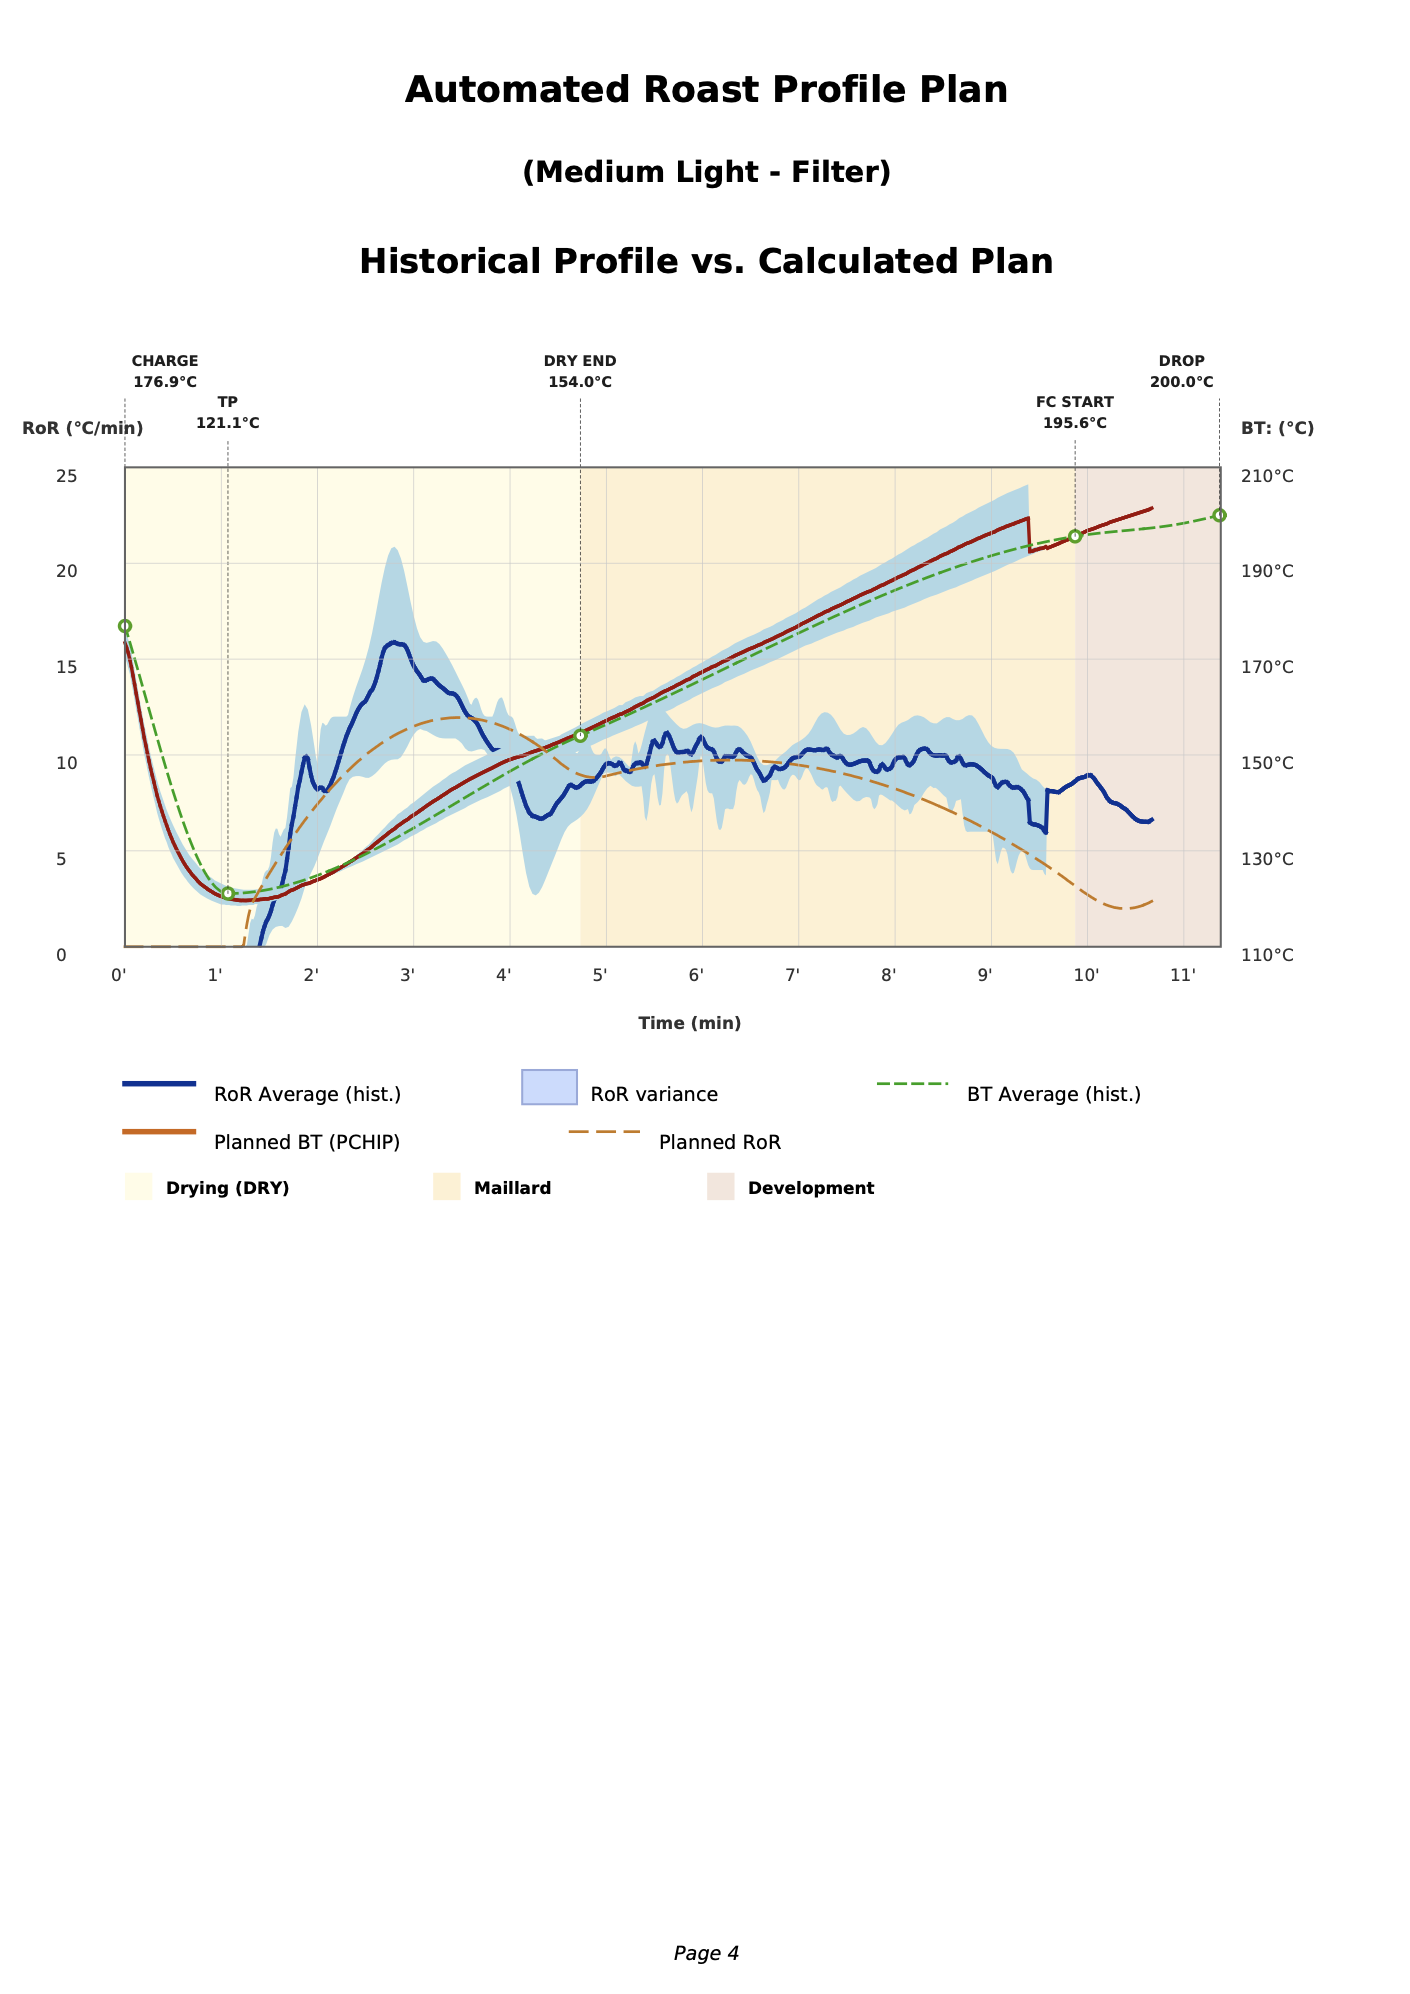
The curve. Planned BT and Planned RoR, a smooth curve the real roast can be laid over.
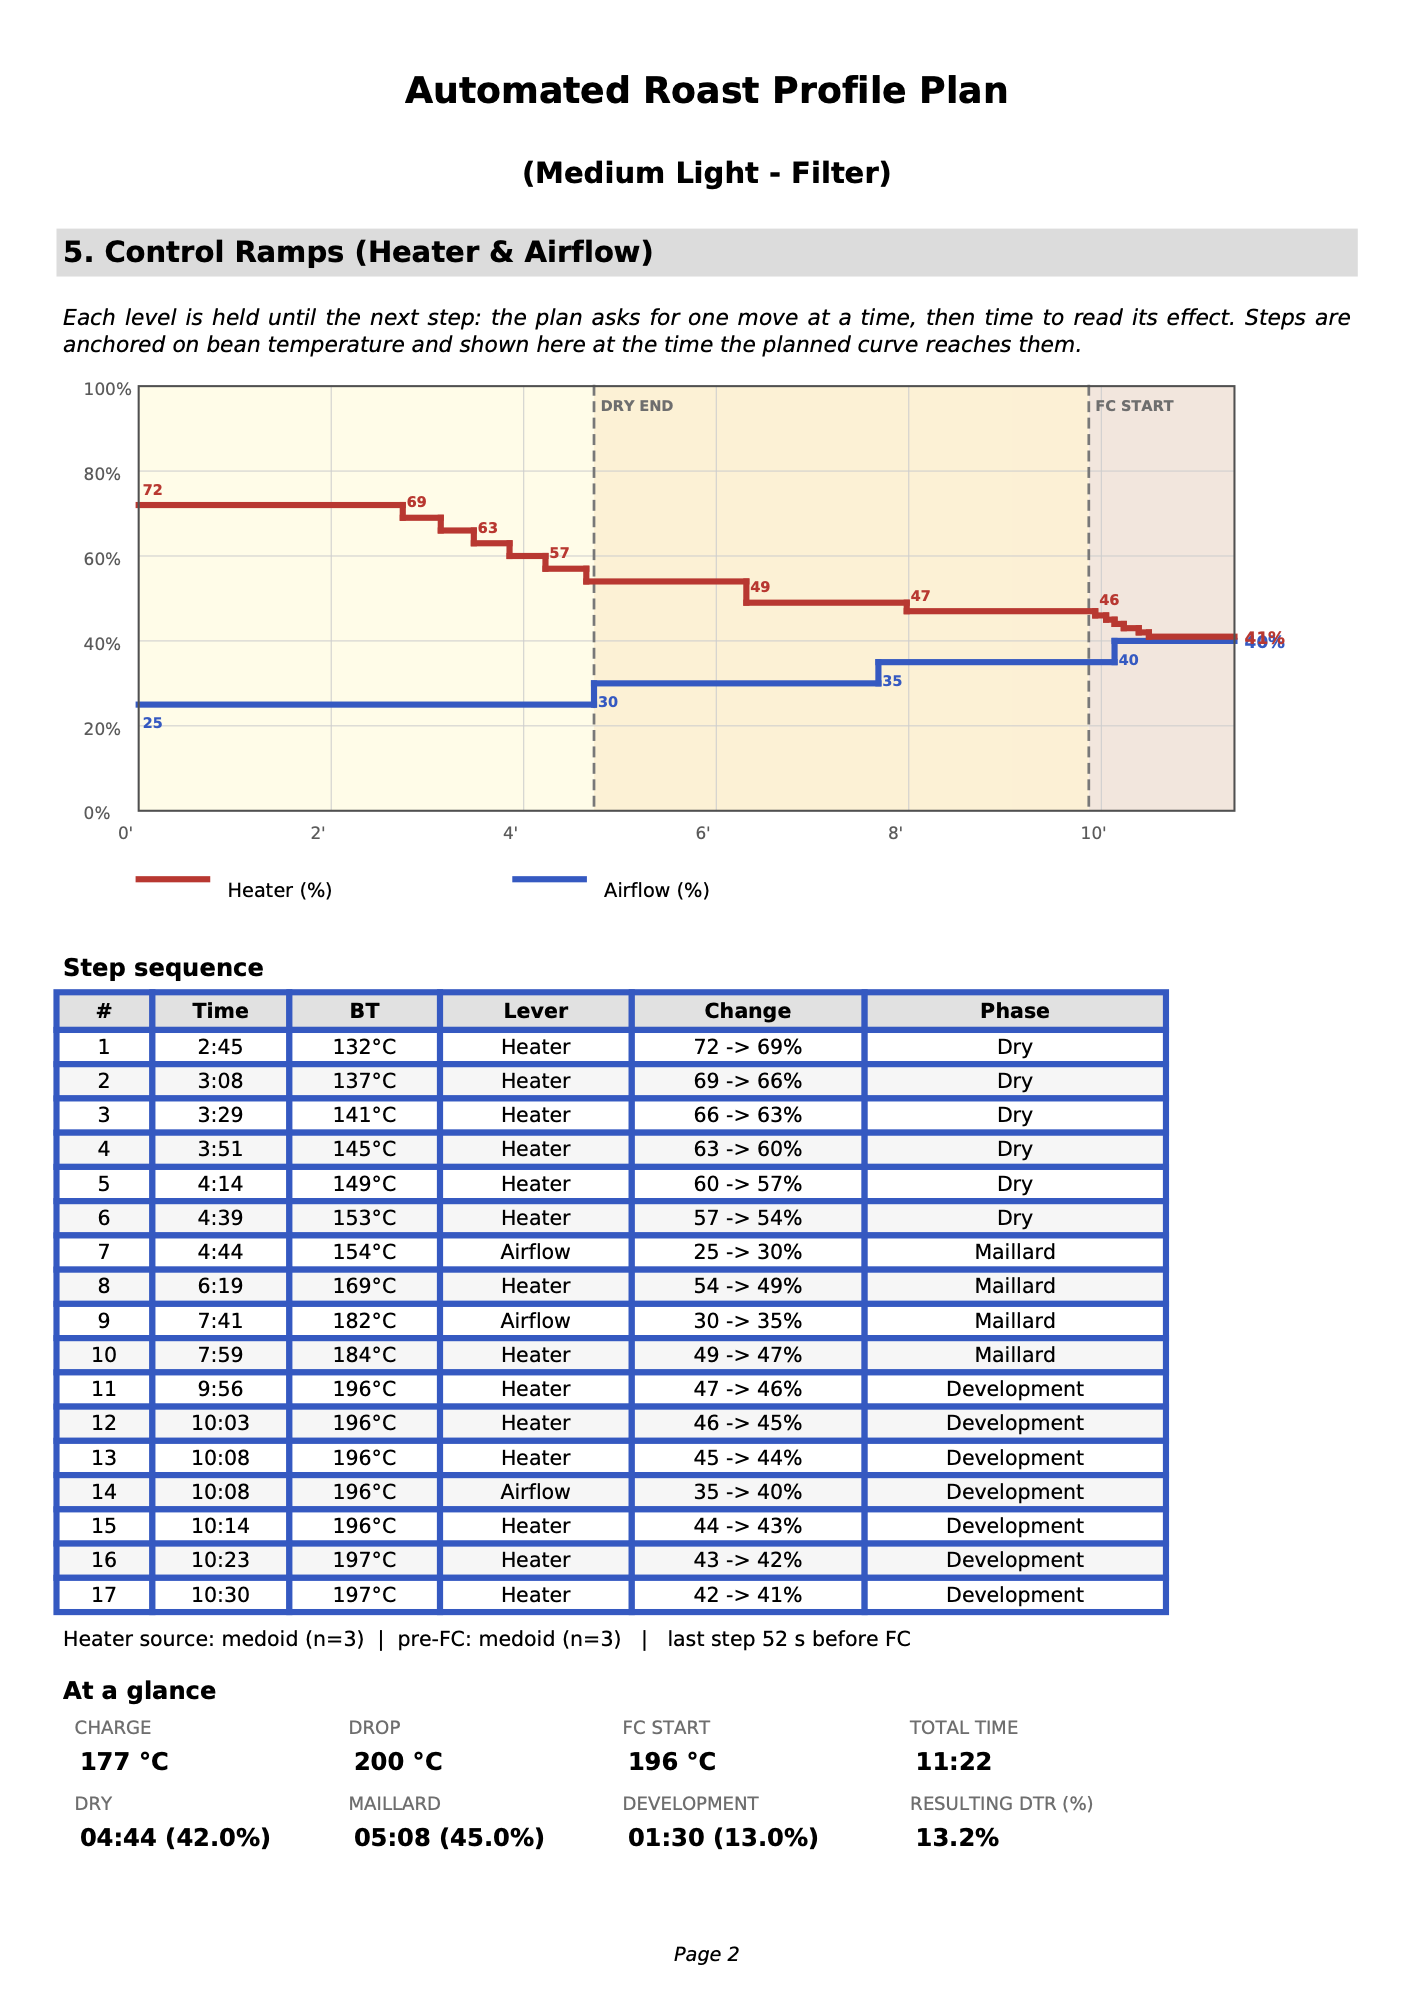
The heat profile. Heater and Heater ramp (anticipated) — the reductions are planned before first crack, not applied after it, down to last step {n} s before FC. This is the difference between a heat cut that controls first crack and one that arrives too late and flattens the curve.
Before dry end the ladder normally does nothing: a charge temperature and an initial heat that suit the coffee carry it through drying untouched. When they do not — when this coffee has shown a rate of rise that flattens too early — you bring the burner down during drying to put the curve back on a slope. The plan learns that from your own roasts rather than inventing it: when it starts, how large your steps are, and the value you land on at dry end. A coffee you have never had to correct gets no reduction scheduled at all.
After dry end the ladder follows its grid or learned settings. Coffee properties do not impose a heater floor, but the machine does. Where a roaster has been measured for it, the plan never asks for a setting below the power that still sustains the reaction — on the Skywalker V2 (the ITOP Cyberroaster profile), 45%. Below it the element keeps heating but no longer feeds the roast, and the rate of rise gives way. The floor applies to every phase, and it applies to a setting learned from your own history as much as to one off the grid: a habit of dropping lower is exactly what it is there to stop from spreading.
The band just above the floor, 45–50%, is reported as a low-margin zone. That one is a note, not a limit — the plan will still ask for it, and you decide from the live rate of rise whether to hold. These are machine observations, not electrical cut-offs or bean-chemistry laws.
Machine settings at phase entry. A table of what each lever must read as a phase begins: at charge, when bean temperature reaches dry end, and at first crack. Not an average for the phase — an average is not a setting anyone dials, and treating one as an instruction puts the middle of the descent at the start of the phase. Expect the burner to show the same value at charge and at dry end: the drying fire is held through dry end, and the descent starts just after it.
The control ramps, on their own page. The heat ladder used to be a run of value @ temperature pairs — exact, unreadable while roasting. It is now a chart plus a checklist. The chart draws the whole roast with burner in red and airflow in blue, the drying, Maillard and development bands behind them, the dry-end and first-crack marks, and the value each lever finishes on in the right margin. Each level is a step held until the next change, because that is what the plan asks for — one move, then time to read its effect, never a continuous slide. Below it, every gesture in order: its time, the bean temperature that triggers it, which lever, and from what to what. Then At a glance — charge and drop temperatures, first crack, total time, and the duration of each phase with its share of the roast.
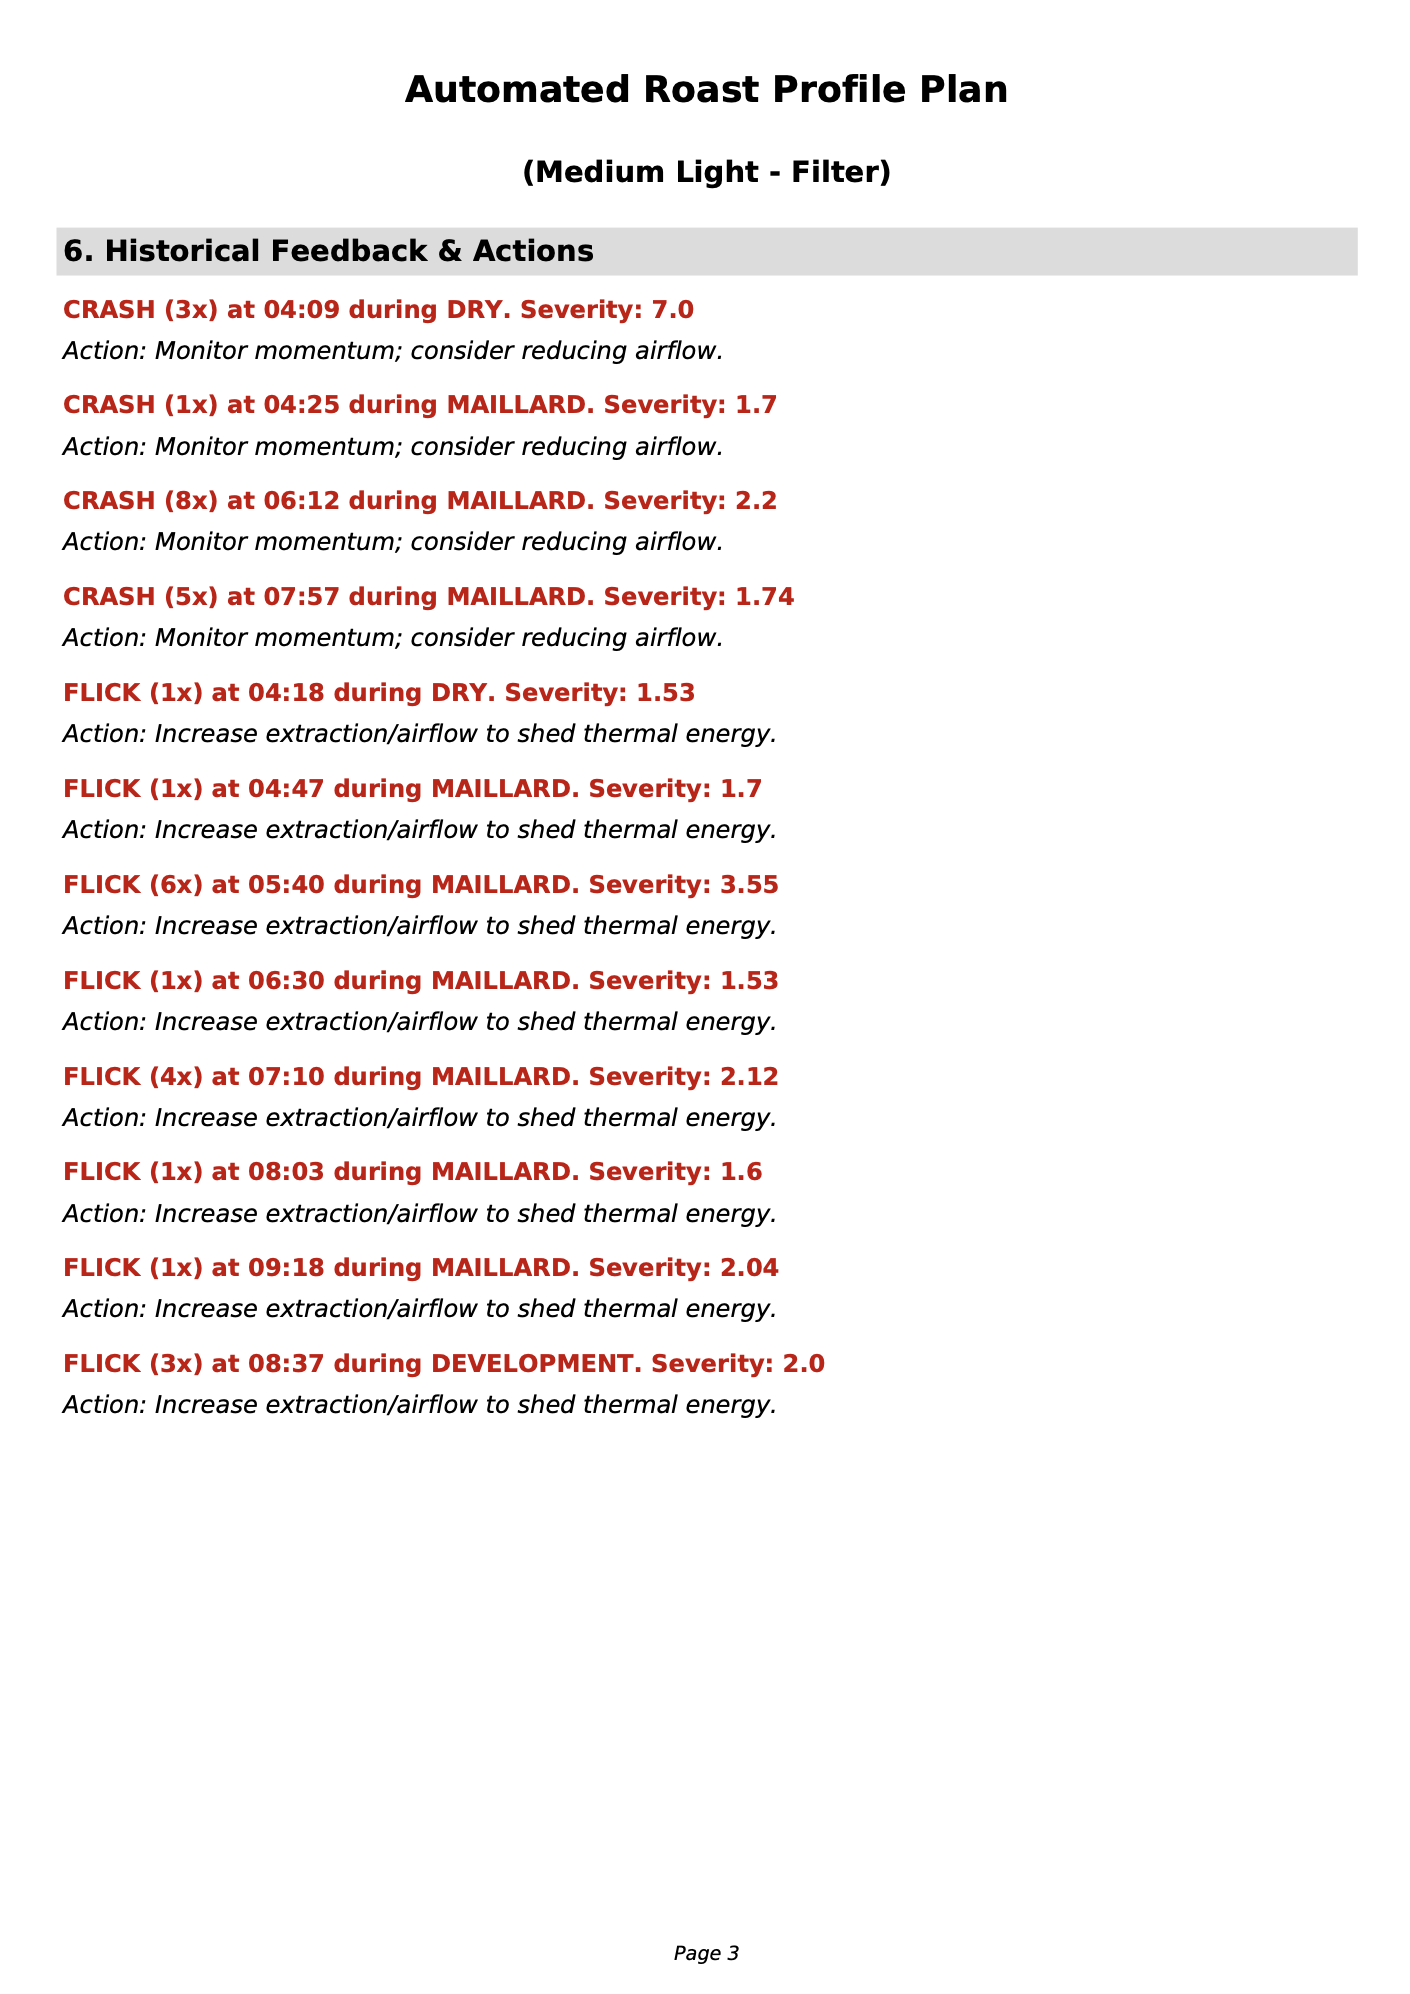
Airflow. Airflow, AirWave, AirWave Mode, with the reason attached — to smooth RoR, to prevent crash, Action: Increase extraction/airflow to shed thermal energy.
Drum speed. Drum Speed and Control, computed once for this batch — see Preparing a roast for why drum speed is a setup decision.
Action notes. Each requested gesture comes with its reason (Action: Reduce burner 10% 45s before, Action: Boost heater). A plan you understand is a plan you can learn from; a list of orders is not.
Risk markers. CRASH and FLICK points with a Severity, plus RoR variance — the plan knows where this coffee is likely to crash or flick before it happens.
Geometry notes. An unusual Maillard reference shape is reported as information to compare with live measurements. The fallback decay exponent is a drawing aid, not proof that a flick, a sensory defect, or an unrecoverable roast will follow.
!!! note Every temperature in the plan is a bean temperature and every duration is in minutes and seconds. The PDF states this, and it also restates the target Agtron profile the plan was computed for, so a printed plan cannot be misread later.
Where each value comes from
This is the part that distinguishes the plan from a reference curve: it never hides whether it is speaking from your experience or from a reference table.
Alongside the values, the plan carries First Crack source, Heater source, Phase timing
source, Drop RoR source and Drop Temp Source. They identify the shared historical profile:
medoid (n=N) for the representative real roast, grid/profile blend (n=2), or grid.
With one complete roast, History profile says reference only (n=1) while the individual
targets remain on the grid.
A fourth label, skeleton (n=N), appears when the only matching roasts recorded no slider
movements — driven on the PID, or with event logging switched off. Those roasts still show
where the coffee cracks and where it was finished, so first crack, the phase timings and the
drop are taken from them; the heater and airflow stay on the grid, because a roast that logged
no hand cannot describe one. It is a last resort: with two fully recorded roasts available, it
never applies.
Above these sits History support, in plain words. It describes the amount and consistency of available history; it is not a probability that the plan will be accurate:
| History support | Meaning |
|---|---|
| consistent history | Enough of your own roasts, and their measurements agree. |
| partial history | Some history, not enough to support every value. |
| grid only | Reference values; too few matching roasts exist. |
A first roast of a new coffee is labelled grid only — unless it is a new harvest of a coffee you have already roasted, in which case the label names that harvest: 2024 harvest (4 roasts) · partial history (see below).
Which previous roasts count
References are drawn only from roasts of the same coffee — matched on its BeanCave identity, not on a similar-looking name — and at a comparable batch size. A 250 g roast is not used as a reference for a 450 g one, because it never was one. This is what stops a plan from being steered by a curve that had nothing to do with the batch in the drum.
A new harvest of a coffee you already roast starts from the previous one. The previous harvest is the same coffee — same name, country and process — from an earlier crop year; a 🌱 New crop record keeps the name, so it is found without anything to set. What carries over is the coffee’s calendar: its first crack temperature, how long drying and Maillard last, and the drop temperature for the colour you aim for. These follow the variety and the process, which do not change from one harvest to the next. The burner does not carry over: how much heat a lot needs depends on its moisture and density, and the plan reads those from the new lot’s own measurements. Each part of the calendar comes from the previous harvest until the new one has two roasts of its own for it, then from the new harvest alone — the two lots are never mixed. The plan says so in History support, and prints the previous harvest’s moisture beside this lot’s under Bean Humidity, so a difference between the two lots is visible before you roast.
Your tasting of the coffee’s last roast adds one more change on top. If you ticked what was off — Flat, papery, Burnt, … — the plan makes the one change it asks for (a notch of burner, a few degrees at charge or drop, or 20 s of development), and the roast setup names it. See Tasting.
One figure is learned from a wider set: the burner you start on. It comes from your roasts of the same process at the same batch size, whatever the coffee was — a washed coffee at 400 g is answered by every washed 400 g roast you have done. The coffee has no opinion on how the machine heats; the batch size and the process do, and the wider set gives a firmer answer than the one or two roasts of a single bean. Maillard and development burner stay learned from that coffee alone, because those follow the colour you are aiming for. When the wider set decides, the plan says so and prints the figure it holds — after any between-batch correction, not before.
How history becomes a plan
The plan no longer combines separate medians for phase times, heater, airflow, first crack and drop. That could describe a synthetic roast that was never performed. Instead it selects one complete historical roast and keeps its timings, milestone settings and development trajectory together.
- With no complete matching observation, the reference grid is used.
- With one observation, the grid remains authoritative and the roast is shown as a reference.
- With two observations, the roast closest in batch mass and target colour is blended cautiously with the grid.
- With three or more, the plan selects the most representative real roast: the one with the smallest robust overall distance to the others across phase durations, heater, airflow, first crack, drop and finishing rate of rise.
Whole-bean and ground-colour histories remain separate. A ground-colour cohort is preferred once it contains two complete roasts; otherwise whole-bean history is used. The PDF’s History profile line states whether the source is grid, reference only, a grid/profile blend or a representative historical roast.
Predictive validation
When a plan is used by the guided assistant, TilauScope freezes its initial prediction before charge and stores it with the roast profile. The record includes the plan and model identifiers, its grid/history sources, predicted dry end, first crack and drop, the target colour, and the heater and airflow expected at those milestones. Replanning during the roast does not rewrite this starting prediction.
When the profile is saved, the observed milestone times and bean temperatures are added. Whole and ground colour readings are converted to Agtron and retained separately. TilauScope can then calculate absolute timing, temperature and colour errors using only predictions that existed before their roasts. Entering a colour later and saving the profile again updates the observation without changing the original prediction.
These records do not yet produce a low, medium or high confidence label. Such a label will
only be introduced when enough pre-roast predictions exist to validate meaningful error bands;
the current History support label continues to describe available history, not forecast
accuracy.
Guardrails
Learning is bounded. Values that fall outside professional roasting ranges are rejected rather than adopted, and where a learned figure is implausible the plan falls back to the reference and says so through its source labels. A single bad roast does not move the plan; a consistent habit does.
If the request itself cannot be met — a target that no plan could reach for this coffee and this batch — the plan says OUT OF SCOPE instead of drawing a curve that cannot be followed.
!!! tip A roast you know went wrong can be excluded from learning altogether, from the assistant at the end of the roast. Use it: the plan is only as good as the roasts it believes.
Next
- What the assistant does with the plan while the drum turns: see The guided roast.
- Entering the batch, the coffee and the preheat: see Preparing a roast.