tilauscope_fork
After the roast
!!! abstract “Artisan does / TilauScope adds” Artisan does — records the curve and saves it. Reading it back means loading it and reading raw numbers.
**TilauScope adds** — a record that can be reopened and completed later, a reading that
grades the roast against your own history, a profile analysis that points to where the rate
of rise left a reference and says what that may mean, a way to compare several roasts side
by side, and correction to the timeline after the fact.
This chapter picks up where The guided roast leaves off: ROAST SUMMARY, colour closing the loop into the next plan, and 🚫 Exclude from learning all happen right at DROP and are documented there. What follows here is everything reached later, from BeanCave → Roasts.
The roast review
The moment a recording is stopped, the left of the roasting window has nothing left to steer. The machine controls, the readouts above them and the status line all describe a live session, so the whole column is given over to the roast review: what the roast did, and how it compares to the plan.
The same thing happens when a past roast is opened from File → Open, whether to look at it or to replay it in the simulator, and whenever the roasting window opens on a finished roast, such as the last one reopened when the application starts. There is nothing to switch on or off — switching monitoring on, starting a recording or a simulation hands the column back to the live session, and RESET clears it.
At the Guided level the docked assistant steps aside for the review, since the roast it was guiding is over. Calling the assistant back — with the assistant button, or by setting up the next roast from BeanCave — hands it the column again.
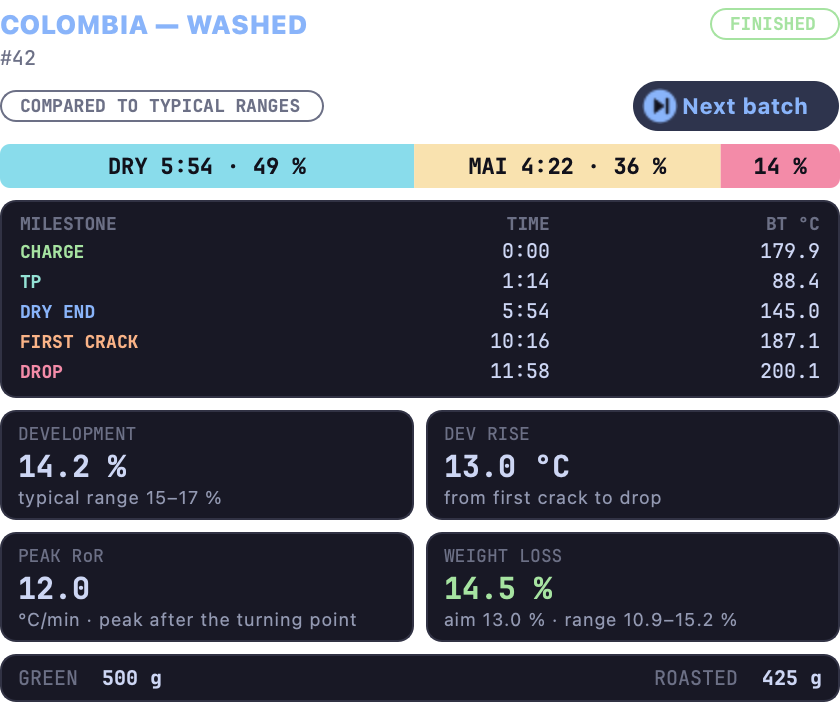
The review reads from the top down:
The verdict. One sentence saying whether the roast ran to plan, the single deviation that mattered most, and one thing to do differently next time. It is the only part meant to be read during a two-second glance; everything below it is the evidence behind it.
The phase ribbon. Drying, Maillard and development, each with its duration and its share of the roast.
The milestones. Charge, turning point, dry end, first crack and drop — each with its time and its bean temperature. When the roast has a plan, dry end, first crack and drop also show how far they landed from it: on the clock for the first two and on temperature for the drop, because that is how each one is actually steered.
Four figures. Development, development rise, the peak rate of rise and weight loss. Each is shown with the plan’s target or the typical range for the roast level, so no figure has to be judged on its own. That level is read from the roast itself — how long it developed and how hot it left — as Coach’s Advice reads it, never from the colour measured afterwards. Weight loss also follows the water this particular lot carried and the development the roast actually got; the panel shows its aim and the range it is judged on, so a loss a little under the aim but inside that range reads as fine.
Under the figures, the Coach card sums up the coach’s reading in one line: the level the roast was read at, and the remark that matters most — or that every check is within range. Tapping the card opens the full reading, the same one BeanCave shows under Coach’s Advice. Below it sit the weights, the colour and the room conditions the roast was recorded in.
Next batch, the blue pill at the top of the review, prepares the next roast of the same coffee. It saves this roast if needed, resets, puts back the same coffee, its charge weight and its density, moisture and green bean temperature, and loads this roast as the background curve. Nothing heats and nothing records until you press MONITOR and START. At the Guided level the assistant comes back with that coffee selected. It keeps the roasting target of the last setup when that setup was for the same coffee; for another coffee the target is left empty, and the assistant waits until you pick one.
!!! note “When there is no plan to compare against” A roast started outside the guided assistant, and any roast file recorded before this feature existed, carries no plan. The review then sets each figure against its typical range for the roast level — COMPARED TO TYPICAL RANGES — and gives no verdict, since there is no plan to judge the roast by.
!!! note “Colour is reported, never prescribed” When the plan has a colour target, the measured colour is shown next to it. The advice never tells you to drop hotter or cooler to correct a colour: no reliable relationship between drop temperature and colour has been established, and inventing one would be worse than silence.
If the roasted weight has not been entered yet, the review offers to take it — the only missing value that can still be measured at that moment. Filling it in updates the review straight away.
A milestone marked late, or forgotten, can be corrected on the curve beside the review — drag it sideways, or right-click where it happened. The review is recalculated as soon as the correction is made. See Correcting a milestone.
Finishing a roast later
A roast is not always completed on the spot — a batch relaunched with Restart batch (see The guided roast) saves without its result form, and an older or imported file can simply be missing fields.
In the Roasts tab, a roast saved without its result opens under a banner that says so: Record result opens the exact same result form as the one shown at DROP — weight, colour, notes — whenever it is convenient to fill it in. ⋯ → Record result… opens it for any roast, to correct one already filled in. Confirming it writes the result into the roast file.

Such a roast is easy to find again: its row in the list carries a No result badge.
The Roasts tab
BeanCave → Roasts lists every roast file on the left, on two lines each: the coffee and the time it was roasted, then its process, crop year and charge weight, with the batch number on the right. The dot in front of a roast carries its measured colour, on the same roast scale as the rest of the application: filled for a ground reading, an outline of that colour for a whole-bean reading, which runs a shade darker on the same meter, and an empty grey ring when no colour was recorded. A No result badge marks a roast whose weight and colour were never filled in — see Finishing a roast later.
Roasts are grouped under a heading per day — Today, Yesterday, then the date — with the number of roasts that day. The heading of the day at the top of the list stays in place while you scroll.
- Search matches the coffee, its process, crop year, farm and country, and the batch
number (type
#44). Accents and capitals do not matter, and every word typed must match. Ctrl+F (⌘F on macOS) moves to the search box; Esc empties it. - All coffees narrows the list to one coffee, each shown with its number of roasts. Double-clicking a coffee in BeanCave’s Green Beans tab, or All 4 roasts → on its record, opens the Roasts tab narrowed to that coffee. Selecting a coffee with a single click does not change the list. While the list shows one coffee, a chip names it — ☕ Caturra · 2025 · 4 roasts — in place of the menu, and its ✕ shows every coffee again. A coffee never roasted says so — Guji 74110 has no roast yet — with Show all coffees to leave it.
- The order menu offers Most recent, Oldest first and Coffee A–Z. In coffee order the headings name the coffee instead of the day, and each roast shows its charge weight and its roasted weight. The order is kept for next time; the search and the coffee filter are not.
Under the list, the count reads how many roasts are shown out of the total, with Clear filters beside it while a search or a coffee filter is active.
Searching never changes the roast on the right: a roast the search hides stays on screen, and selected, until you click another one.
Selecting one roast — or several at once — fills the right side. BeanCave opens on the roast you are most likely to want rather than on the top row: whichever roast is currently loaded in TilauScope, or failing that the one you had selected last time, or failing that your most recent roast.
A selected roast opens under its name and the day it was roasted, with its process, crop year and batch number, and five figures, each with what it means underneath:
| Figure | Underneath |
|---|---|
| Roasted weight | The weight loss, the charge weight it came from and, when the coffee has a price, what that green cost — hover it for the cost per roasted kg |
| Roast time | The development time, when first crack was marked |
| Drop temperature | The bean temperature at first crack |
| Colour | Ground and its colour category — or Whole bean, which is given no category |
| Energy | The kWh per kg of green coffee and where the figure comes from — see Energy; a › opens the roast’s energy detail |
A figure that was never recorded reads Not recorded. With several roasts selected, the head reads how many are compared, names each one in its curve’s colour, and gives the roast time, drop temperature and colour as a range with its spread. Colour is compared only when every roast was measured the same way, all ground or all whole bean. Clear returns to the first of them, on its own. Up to five roasts are drawn at once.
Beside the roast’s name, Load in Artisan opens the roast in Artisan’s own view for full analysis, drawn with bean temperature, its projection and its rate of rise — see Configuration. Background loads it as a comparison curve behind whatever is roasting or being reviewed next. Export holds the roast’s label — as a PDF, or printed on the paired label printer, whose state shows at the foot of the menu — the roast card and an image of the curve; see Sharing a roast. The ⋯ menu holds the rest: Record result…, Taste… (see Tasting), Planning, Dial-in, Data and Refresh list.
!!! note Planning and Dial-in, in the ⋯ menu, are about brewing the roast rather than reading it back — see Filter coffee and espresso (Brew).
Reading the curve
Curve, at the top of the card under the figures, shows the recorded curve — BT and ET, BT alone for a machine without an air probe, or ET alone for one that roasts on its air probe — drawn exactly as the roasting window draws it: the same frame, the same phase grounds, the same milestone labels parked in rows above the curve rather than sitting on it, and the same lever strips underneath. A roast reviewed is the same picture as the roast that was driven. When a crack probe counted during the roast, one tick per pop runs along the foot of the plot, exactly as in the roasting window — see Listening to the crack. Statistics, beside it, holds the reading described under Coach’s Advice, and Analysis the one described under Profile analysis. At the right of that row, on Curve, the full-screen button opens the curve on the whole window; the same button, or ESC, closes it.
Under the card, three choices change what the curve shows, and are kept for next time:
- View — Temperatures, Rate of rise or Both: the bean and air temperatures, their rate of rise, or the two together.
- Time range — Auto fits the roast from charge to drop; 0–12 min keeps the same scale from one roast to the next, so two roasts read alike at a glance; Custom… asks for a start and an end, and says so when the end is less than half a minute after the start.
- Burner & air — the strip of burner, air and drum settings under the curve: the settings that explain its shape.
With two or more roasts selected, Time range and Burner & air step aside — a comparison is framed on its roasts — and View offers three ways to compare them instead:
- Overlay draws every roast on the same axes, each in its own colour.
- Consistency overlays the selected roasts on one reference, with a shaded band showing how much they spread — a tight band means the same coffee roasted the same way twice; a wide one flags what actually varied.
- Aligned stretches each roast so its milestones line up with the reference roast’s, so the shape of a phase can be compared independent of how long it happened to run. No rate of rise is drawn in this view: stretching time would make the rate a figure about nothing.
A comparison is drawn the way the roasting window draws a roast: the same frame, the same phase grounds, the same milestone labels parked above the curves. The first roast selected holds the chart — it keeps the bean colour, carries the phase grounds and the labelled milestones, and every other roast is drawn against it in a colour of its own. Where those roasts reached each milestone is marked on the time axis underneath, so a roast that dried later is seen rather than read.
Resting the pointer anywhere on the chart draws a crosshair, reads the bean temperature, air temperature and rate of rise of the roast holding the chart, and dots every other roast at the same instant in its own colour.
Under the curves, a gap strip measures each roast against the one holding the chart, from charge to drop — each roast’s own drop, so a roast dropped first ends there rather than trailing into its cooling tray: the reference is the flat line through the middle, and everything else is how far that roast ran from it, on a scale of its own so that a few degrees are visible rather than lost against the temperature axis. Its right-hand figure says how wide the strip is.
Each roast is then named under the chart with the colour it is drawn in, how long it took, and how its time split between drying, Maillard and development. A name that will not fit gives up its split, then its time, so a roast is never drawn without being named.


Correcting the timeline afterward
A milestone is corrected here with the same gestures as on the roasting window: drag its label sideways to move it, right-click the curve at a moment to add one that is missing — see Correcting a milestone for what a drag follows and where it is allowed to stop. One thing differs: this is a roast on file, so nothing is written as you go. The correction is staged, and a pill above the curve names it — the milestone with its time on file and its new time, or how many milestones were corrected — with Save to write it into the roast file and Undo to put the milestones back as the file has them. A milestone let go where it was, or brought back to its place, stages nothing, and a correction left unsaved is dropped when another roast is shown.

Reading back every sample
⋯ → Data opens a full, read-only table of everything recorded — every sample, every phase metric — with a navigator down the side that jumps straight to any milestone. Time is shown from when recording actually started, so the preheat before CHARGE can be read too. Nothing here can be changed; it exists for a real, unhurried read of the roast, when the curve alone does not answer the question.
The view stays open while you work in the roast list: selecting another roast shows that roast in it, with the same filter and, where the roast has one, the same milestone selected — so one point of the roast can be read across several roasts in a row.

Coach’s Advice
Statistics, beside Curve in the Roasts tab, reads the finished roast, not the plan for it; the Coach card in the roast review opens the same reading in the roasting window. The roast level it judges against is read from what the roast did — how long the bean developed and how hot it left, the pair that sets the colour — corrected for your machine’s own probe, never from the colour measured afterwards. The advice opens by naming that level and the pair it was read from; where the arrival lands closer to a neighbouring level than the roaster can resolve, both are named, because a home machine’s drop temperature is not a laboratory measurement.
The colour is the result of the roast, so a roast whose colour disagrees is a roast that cooked badly, not a roast that belongs to another level. It is shown for what it is, with a category name only when it was measured on ground beans, since that is the scale those names belong to.
The four figures above the advice are average rises: the degrees gained across a phase divided by its length, from the turning point to the drop. They are not the rate of rise drawn on the curve, which moves throughout each phase — a drying phase averaging 12°/min contains readings well above and well below that.
Weight loss and DTR are checked against sane ranges for that roast level and the coffee’s process — each with the tolerance its own measurement deserves, so a ratio a tenth of a point over a limit, or a weight loss within a gram of the floor, is not reported as a fault; each phase duration is checked against your own history of this coffee where you have one, and against general guidance where you do not; drop temperature and DTR are cross-checked to catch an under- or over-developed roast even when either figure alone looks fine; and the rate of rise around first crack is read for a stall, a crash or a flick. Only an accident large enough to be visible on the curve is named, and only the most pronounced one, with the time it happened — so you can go and look at that spot yourself.
!!! note This is a different reading from the Judging the batch plan shown before roasting (see Preparing a roast). That one works from the coffee and the plan; this one works from what was actually measured.

Profile analysis
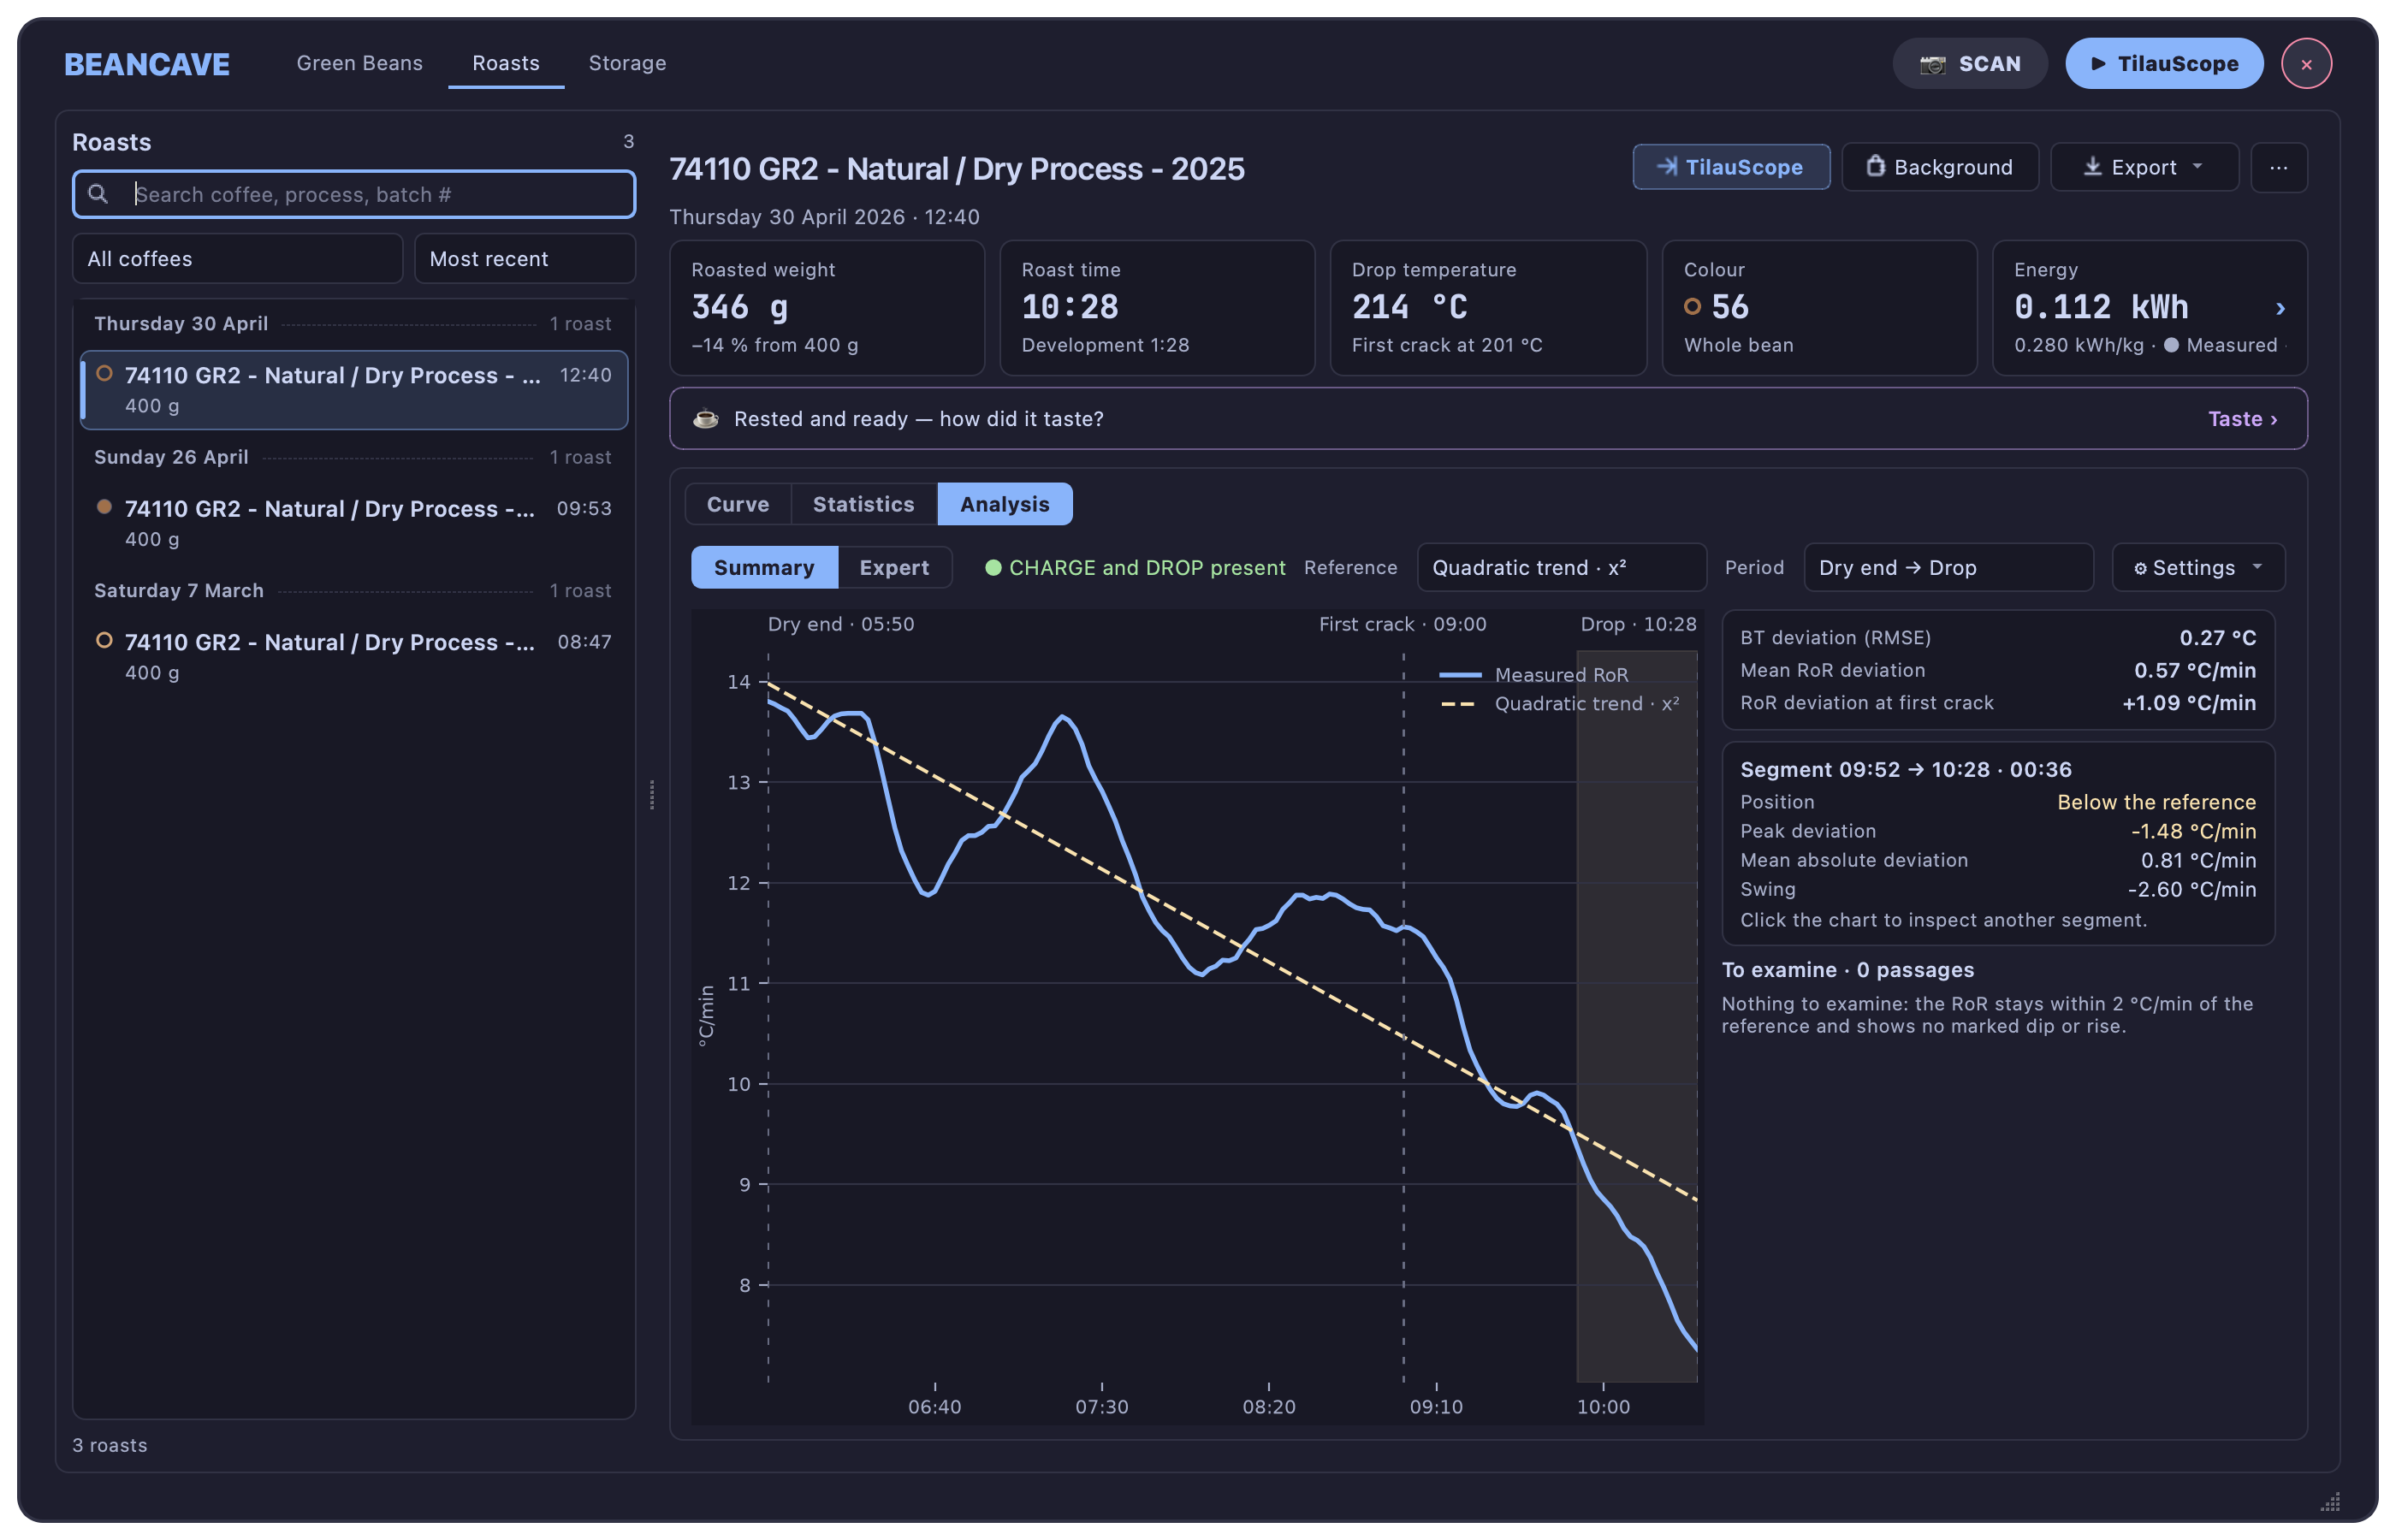
Artisan’s Analyzer fits a trend to the bean temperature and prints, in two text boxes over the curve, how far the rate of rise strayed from it. Analysis, beside Statistics in the Roasts tab, takes its place — the Analyzer is no longer offered in the Tools menu. It runs the same kind of reading on the roast selected, lays it out as a page, and names the passages worth a look. It is computed only while the page is open, one roast at a time — select a single roast; the page waits while you browse.
The row at the top holds the choices:
- Reference — what the measured rate of rise is compared with: a reference trend fitted to the roast itself (quadratic, cubic or logarithmic), or Previous roast, the latest earlier roast of the same coffee, aligned on CHARGE and read up to whichever roast dropped first. Its name shows when the pointer rests on the choice.
- Period — from dry end to DROP, or from two minutes before first crack to DROP.
- ⚙ Settings — where the trend is fitted from, if not from the start of the period, and the two thresholds under which small wobbles are merged: a duration and a deviation. They group noise; they are not quality limits. The rate of rise itself is smoothed as the curve settings say.
Beside Summary, a mark says whether CHARGE and DROP are both there; without them, or without the dry-end or first-crack mark the period needs, the page says which one is missing and offers to go back to the curve.
Summary puts the chart on the left: the measured rate of rise, the reference dashed, dry end, first crack and DROP ruled across. On the right:
- Three figures — how close the bean temperature stayed to the reference (its root mean square deviation, in °C), the mean gap between the two rates of rise over the period, and the gap at first crack, shown in yellow when it reaches 2 °C/min. Resting the pointer on a figure says what it measures.
- Segment — the stretch of the period where the rate of rise stayed on one side of the reference: when it starts and ends, whether it ran above or below, its largest and mean deviation, and its swing, the change of largest deviation from the segment before. Click anywhere on the chart to read the segment under the pointer; it is shaded on the chart.
- To examine — the passages worth a look, numbered as on the chart. A crash or a flick is named only when the measured rate of rise itself dips or rises by at least 2 °C/min, on the side of the reference that confirms it; a passage that simply runs 2 °C/min slower or faster than the reference is named as such, with its phase; and a rate of rise that does not decline over the period is flagged. Understand opens what the passage usually indicates and what to check — the heat and air changes just before it, the first-crack mark — and every reading ends the same way: confirm it in the cup. Clicking a passage shades its segment on the chart.
Expert sets every reference side by side — the gap in bean temperature, its square, the gap at first crack and the largest gaps each way — and gives the fitted equation, how well it fits, the rate of rise at first crack and the overall slope of both rates of rise.
!!! note Being close to a reference describes the shape of the curve. On its own it does not predict the cup, and a passage named here is something to look at, not a fault. All the figures are in Celsius. They can differ slightly from Artisan’s Analyzer, which works on the smoothed temperatures; this page fits the recorded ones.
Weight, colour and notes
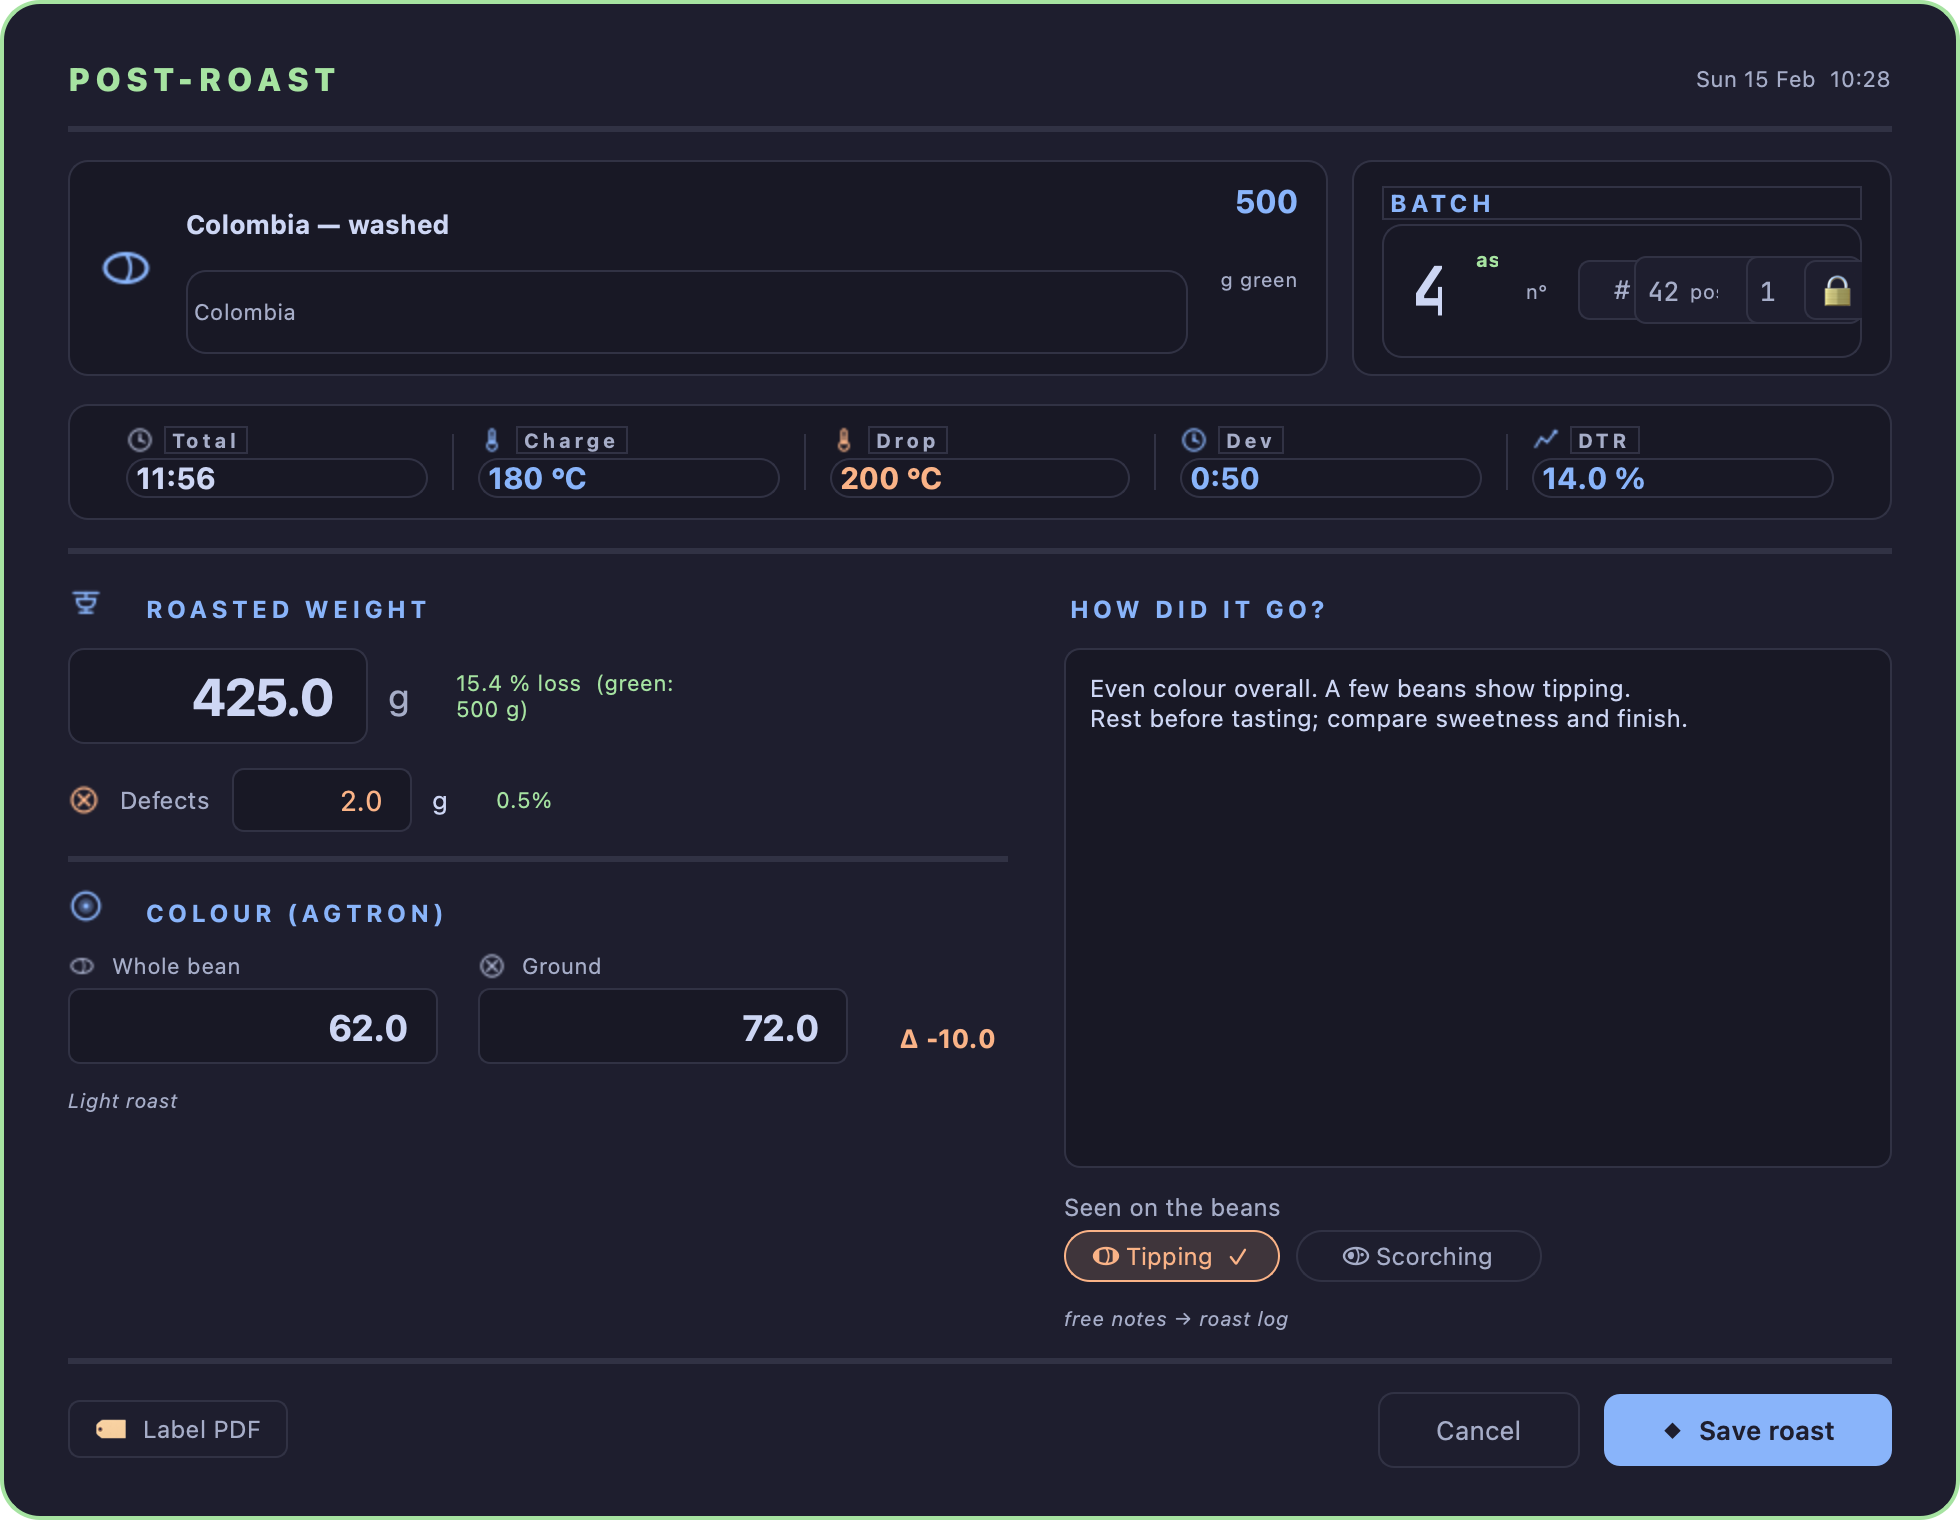
The result form — whether filled at DROP or reopened later — records roasted weight and any defect weight, whole-bean and ground colour, free notes, and the burns visible on the beans. Colour can be typed, judged by eye against named roast levels, or read live from a colour meter where one is paired.
Next to the roasted weight, the form shows the weight loss as soon as the weight is typed, beside the loss to aim for and its range — the same aim the review uses, built from this lot’s moisture, the level the roast ran and its development. It turns green inside the range and orange outside. A roast without first crack and drop marked has no level to read, so only the loss itself is shown.
Across the top the form recalls which roast this is — the coffee, its batch number, and the five figures the roast produced: total time, charge and drop temperature, development time and DTR. Below that, the fields to fill sit on the left and the notes box on the right. On a screen too short for the whole form, this middle part scrolls while the title and ⬥ Save roast stay in place.
Under the notes box, Seen on the beans offers two marks: Tipping, when the ends of the beans are burnt dark, and Scorching, when their flat side carries dark patches — see tipping and scorching. Click one to mark it; it lights up with a ✓, and a second click clears it. The marks are saved with the roast when the form is confirmed — they are the same ones Artisan’s own roast properties show — and a roast reopened later comes back with its marks already set.
Recording a colour is what closes the loop. A roast with a colour on file becomes part of what the next plan for that coffee learns from — see The roast plan for how. A roast left without one simply does not teach the plan anything about drop temperature.
With an AI provider configured, ✦ AI Summary writes a short account of the roast from its recorded figures, and from the colour, the marks and the notes entered in the form — a starting point for notes, not a replacement for judging the cup. What is sent in the same panel shows the exact text the request would carry, cleaned as it will be sent, along with a line naming what was taken out of it; reading it sends nothing.
🏷 Label PDF prints the roast’s label straight from the form, using the weight and colour just entered, so the bag can be labelled while the batch is still cooling. Saving the form without having printed one asks the question once. See Labels and QR.


Tasting
A roast is judged in the cup, once it has rested. When a roast in the Roasts tab has rested long enough, a line under its figures asks Rested and ready — how did it taste? with Taste; ⋯ → Taste… opens the same form at any time.
The form asks three things: Would you roast it the same way again? — 👍 Yes, 🤏 Almost or 👎 No — then what was off, if anything, among six tastes in plain words, and a free note. As you tick, a Next time card names the one change it asks of the next roast of the same coffee:
| What was off | Next time |
|---|---|
| Burnt | Charge 3 °C cooler |
| Bitter, smoky | Burner one notch lower before first crack |
| Flat, papery | Keep the burner one notch higher after first crack |
| Bready, dull | Start with the burner one notch higher |
| Grassy, raw | Let it develop 20 s longer after first crack |
| Sour, thin | Drop 2 °C later |
A notch is 5 % of burner. With several tastes ticked, the first in this list decides: one change at a time, judged on the next roast. Once saved, the line under the roast recalls what you said — Tasted: 🤏 Almost · Flat, papery — with Edit to change it.
The next plan of that coffee makes the change; see The roast plan. Only the tasting of the coffee’s most recent roast counts: once you have roasted it again, the older tasting has done its job. When that roast is excluded from learning, its tasting changes nothing.
Cupping scores and Artisan’s own cupping tools, reached from Load in Artisan, are untouched.
Sharing a roast
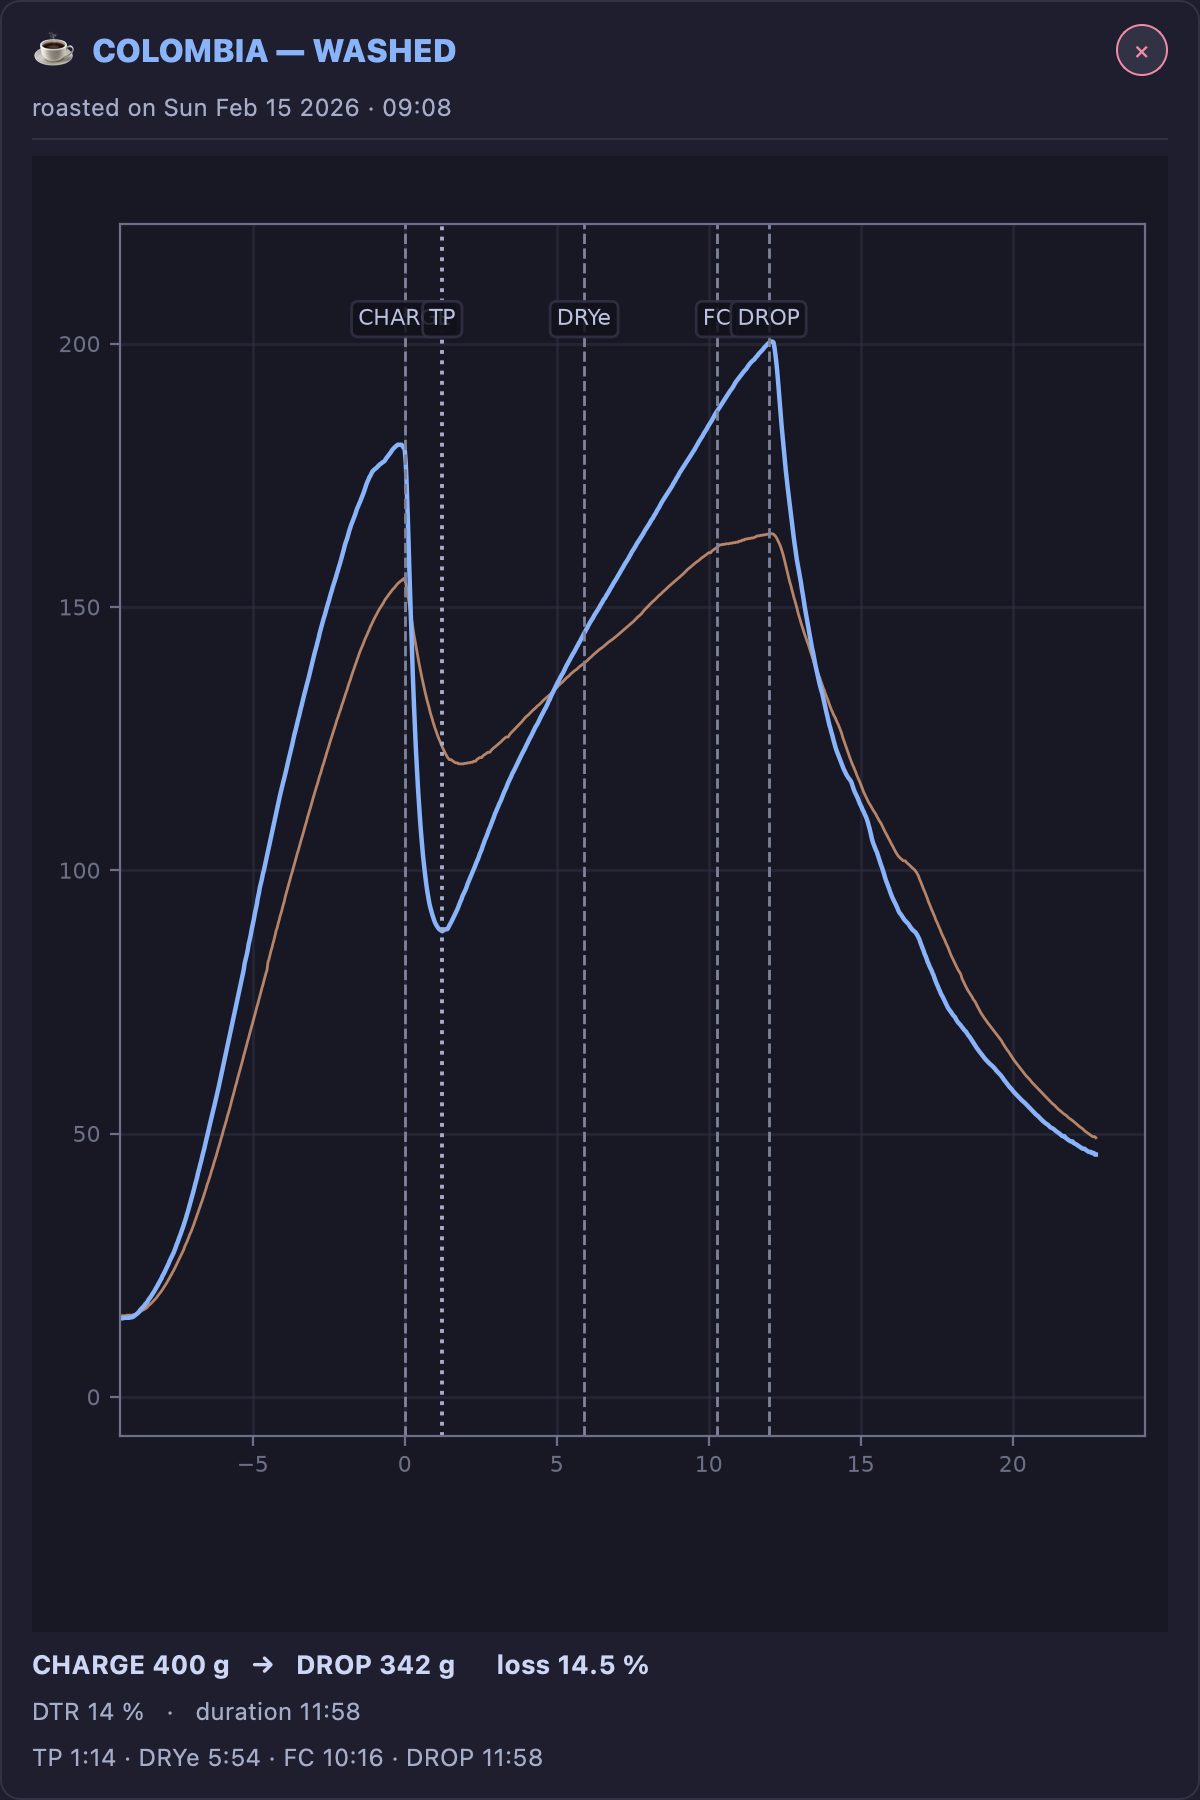
Export → Roast card (PNG) exports the selected roast as a 2160 × 3240 portrait PNG for social sharing. It includes the coffee’s identity, total duration, measured colour (ground or whole bean), and separate temperature and rate-of-rise graphs with the same time axis. When a crack probe counted during the roast, the rate-of-rise graph carries one tick per pop along its foot. Dry end, first crack and drop show elapsed time since charge and bean temperature. Below the graphs, drying, Maillard and development show their durations and shares of the roast; the phase bar is proportional to time. Charge and roasted weights and weight loss complete the card. Missing milestones are labelled Not marked; unavailable phase durations are shown as a dash. The phase bar remains neutral when its boundaries are incomplete. Missing RoR is explicitly indicated; when the turning point is available, RoR starts there. The export uses the profile’s temperature unit. This is the roast’s counterpart to the bean record’s own card (see BeanCave). Export → Curve image (PNG) is simpler: a plain image of the curve exactly as it is displayed, crack ticks included.
Scanning a roast’s printed label or QR opens a different, read-only roast card: title, date, a small curve with its milestones, weight and loss, colour and DTR, key times, tasting notes if present, and a link back to the source coffee. See Labels and QR for printing and scanning; this is what scanning a roast actually shows.
Repairing incomplete roast files
Repair ALogs, opened from TilauScope → Roast Profile Maintenance…, lists every roast file with a completeness mark — missing its coffee link, or missing a field the plan or the record relies on (weights, density, moisture, colour, ambient conditions). Selecting one opens it for editing directly.
A file marked ⛔ damaged cannot serve the roast plan: it cannot be read, a milestone points past the recorded curve, or fewer than 11 samples lie between CHARGE and DROP. While it stays in the roast folder, the plan for its coffee cannot be built. Selecting it shows a red banner naming the defect; move the file out of the roast folder. The summary above the list counts damaged files alongside incomplete ones.
The window opens on its full list straight away. Should the reading take longer — a very large folder, or one on a slow network drive — the list fills in as it goes and a progress bar appears with a Cancel button: the files already listed stay usable, and Scan again picks the reading back up.
Update Roast Counts, above the list, rescans the roast folder and recomputes how many roasts and how much weight each green coffee has behind it — the figures shown in BeanCave’s catalogue.
Complete from bean fills only the fields still empty, from the linked coffee’s own record — nothing already filled is touched. Record validates and writes the file, and keeps the same roast selected so you can check what was saved. The file takes the name Artisan would give it — the title followed by the roast date and time, previewed under → NEW FILENAME. A roast without a readable date keeps the date and time already in its name. If the system refuses the rename (file locked, cloud sync in progress), the repair is still saved under the previous name and a message says so. Next incomplete ▸ moves on to the following file needing attention, so a backlog of half-finished roasts can be cleared in one pass rather than one file open at a time.
!!! note A file is only rewritten to disk when Record is pressed. Browsing the list, or closing without pressing it, changes nothing.
Plan learning is set here too, per file, at the top of the editing panel — three states rather than a switch:
| State | What it means | Does the plan learn from it? |
|---|---|---|
| ✓ Admitted | You opened this roast, checked it, and it is sound. | Yes |
| – Not reviewed | No decision recorded. Every file starts here. | Yes |
| 🚫 Excluded | You judged this roast unfit to teach anything. | No |
Only Excluded keeps a roast out of the history. Admitted does not make the plan trust it more — it records that you looked, so a long list shows at a glance what has been vetted and what has merely never been opened. An imperfect roast still teaches something, which is why Not reviewed is learned from.
The state is written to the file the moment you press it, without Record, and the list marks it: ✅ for admitted, 🚫 for excluded, nothing for not reviewed. Browsing the list never changes a state — only pressing a button does.
The 🚫 switch shown right after DROP sets the same Excluded state.


Next
- What happens at DROP itself: see The guided roast.
- How a recorded colour changes the next plan: see The roast plan.
- Printing or scanning a roast: see Labels and QR.
- A roast saved remotely, from a phone, still needs its weight and colour completed here: see Piloting from a phone.
- Brewing this coffee: see Filter coffee and espresso (Brew).
- Any unfamiliar term: see the Glossary.